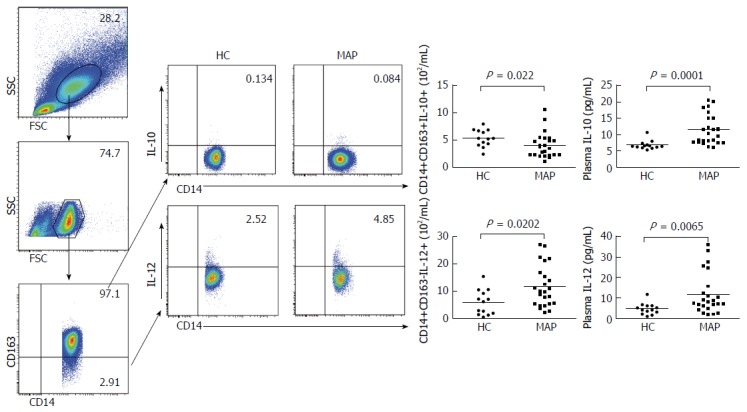
Figure 4.

Analysis of peripheral blood IL-12+ M1 and IL-10+ M2 monocytes and the concentrations of plasma IL-10 and IL-12. Peripheral blood mononuclear cells (PBMCs) were isolated from individual subjects and stimulated with lipopolysaccharide /phorbol myristate acetate/ionomycin in vitro. The cells were stained in duplicate with BV510-anti-CD14 and PE/Cy7-anti-CD163 or isotype controls. The cells were fixed, and permeabilized, followed by intracellular staining with BV421-anti-IL-12 and PE-CF594-anti-IL-10. The numbers of peripheral blood CD14+CD163-IL-12+ M1 and CD14+CD163+IL-10+ M2 monocytes in individual subjects were determined by flow cytometry. The concentrations of plasma IL-10 and IL-12 in individual subjects were determined by cytometric bead analysis. Data are representative FACS charts or the mean numbers of each type of cells and the mean values of each type of cytokine in individual subjects. The horizontal lines indicate the median values for each group. FSC: Forward scatter; SSC: Side scatter; HC: Healthy control; MAP: Mild acute pancreatitis.
