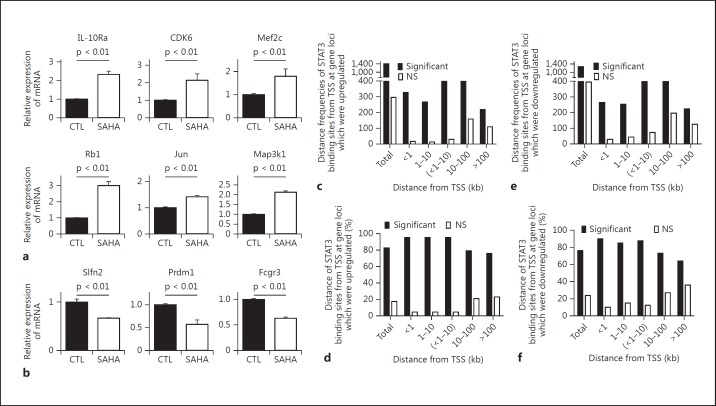
Fig. 5.
Correlation of binding distance of STAT3 with gene expression. Confirmation with qPCR of a random selection of genes associated with STAT3 binding following HDAC inhibition which were upregulated (a) or downregulated (b). Data were combined from 3 independent experiments (mean ± SEM). p values were obtained using an unpaired t test. CTL = Control. c Frequencies (numbers) of distance distribution of STAT3 binding sites from TSS at the gene loci which were significantly or not significantly upregulated. d Percentages of STAT3 binding sites at different distances from TSS at gene loci which were significantly or not significantly upregulated by STAT3. e Frequencies of distances of STAT3 binding sites from TSS at the gene loci which were significantly or not significantly downregulated. f Percentages of STAT3 binding sites at different distances from TSS at gene loci which were significantly or not significantly downregulated by STAT3. NS = Not significant.

