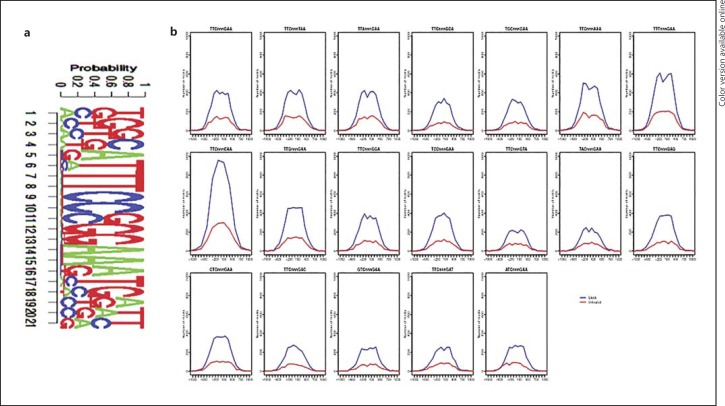
Fig. 6.
Characterization of STAT3 binding motifs following HDAC inhibition. a The top 500 STAT3 binding peaks were examined for the canonical GAS motif TTCnnnGAA using TRANSFAC. b STAT3 binding peaks were examined for canonical and noncanonical GAS motifs. Binding frequencies in SAHA-treated (blue line) and control BMDCS (red line) were shown.

