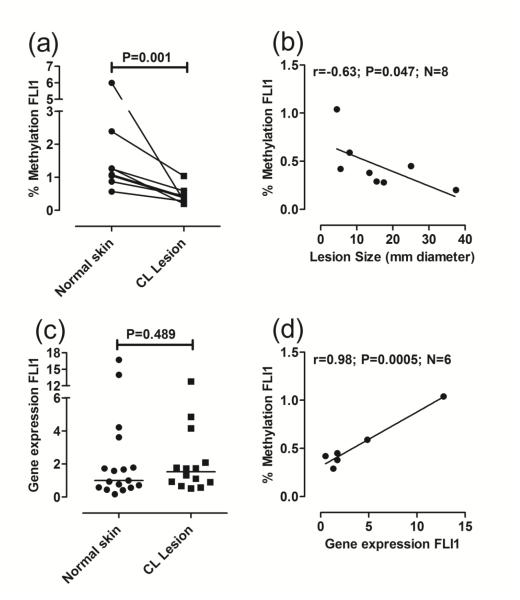
Fig 1. FLI1 promoter-specific DNA methylation and gene expression in lesion compared to normal skin biopsies.
(a) Compares percent methylation in DNA from paired biopsies of normal skin and cutaneous lesions for each individual (N=8 paired observations). DNA methylation was measured using an EpiTect Methyl II PCR assay specific for the FLI1 promoter CpG island (Reference EPHS102855-1A; Qiagen). Following real-time PCR, the data are expressed as percentage of methylated DNA. (b) Plots percent methylation against lesion size expressed as the mean diameter (mm) between two readings taken at right angles to each other. (c) Compares gene expression, represented as 2−ΔΔCT as described in the methods, following qRT/PCR of RNA from biopsies of normal skin (N=17) and cutaneous lesions (N=14). (d) Plots the correlation between percent FLI1 methylation and FLI1 gene expression for paired observations in lesion biopsies. In (a) and (c) P-values are for the non-parametric Mann-Whitney tests comparing data for normal skin biopsies with lesion biopsies. In (b) and (d) results are shown for Pearson’s correlation coefficients (r) and associated P-values are indicated for the number (N) of paired observations available. Lines were fitted using linear regression.

