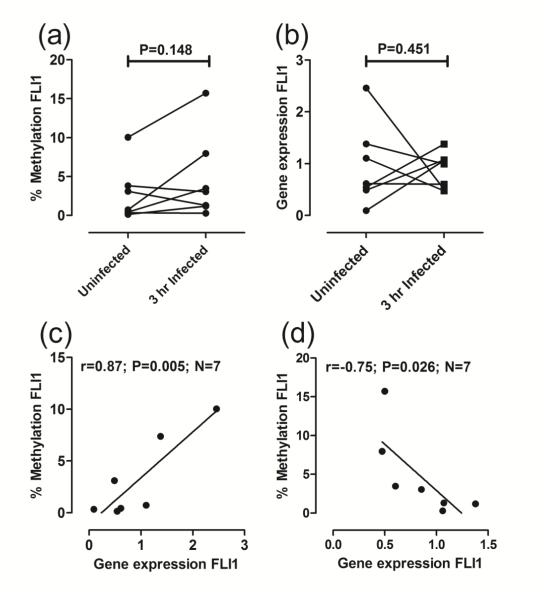
Fig 2. FLI1 promoter-specific DNA methylation and gene expression in monocyte-derived macrophages.
(a) Compares percent FLI1 methylation and (b) FLI1 gene expression, in DNA from paired samples prepared from uninfected macrophages and at 3 hours following infection with L. braziliensis in vitro. P-values are for the non-parametric Mann-Whitney tests comparing uninfected macrophages with 3 hour infected macrophages. (c) and (d) plot percent methylation against FLI1 gene expression for uninfected and 3 hour infected macrophages, respectively. Results are shown for Pearson’s correlation coefficients (r) and associated P-values are indicated for the number (N) of paired observations available. Lines were fitted using linear regression.

