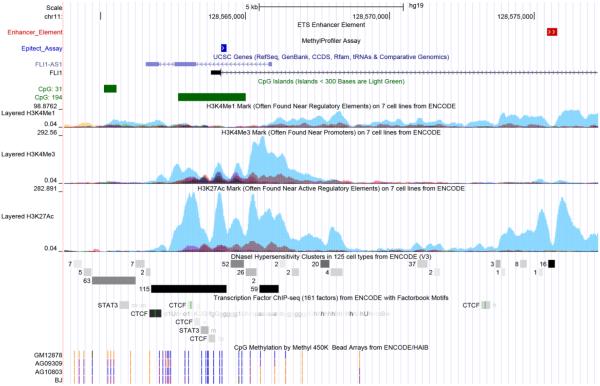
Fig 5. In silico analysis of the 5’ promoter and intron 1 enhancer regions of the FLI1 gene.
Putative regulatory regions in the 5’ and upstream regions of the FLI1 gene were annotated using standard and custom tracks in the UCSC Genome Browser (http://genome.ucsc.edu). The image is based on GRCh37/hg19 assembly. FLI1 is encoded on the forward strand (only exon 1 is shown), and FLI1-AS1 (SENCR) as anti-sense on the reverse strand. The region of the larger CpG island (CpG:194; annotated in green) covered by the methylation assay used in this study is annotated as “Epitect Assay” in blue. An ETS enhancer element in intron 1 of the FLI1 gene is annotated as white arrows on red. The H3K4Me1, H3K4Me3 and H3K27ac tracks are shown for 7 cell lines from the ENCODE (2004) project, the strongest signal (turquoise) is for the HUVEC cell line. DNase hypersensitivity clusters and individual (STAT3; CTCF) or condensed tracts for transcription factor binding sites are annotated in grey scale (light grey to black). ENCODE results for CpG methylation determined using the Illumina Infinium HumanMethylation450 Bead Chip are shown for one B lymphoblastoid cell line (GM12878) and 3 fibroblast cell lines (AG09309, AG10803, BJ). In these tracts blue vertical lines indicate that sites are unmethylated, purple vertical lines that sites are partially methyled, and orange vertical lines that sites are fully methylated.

