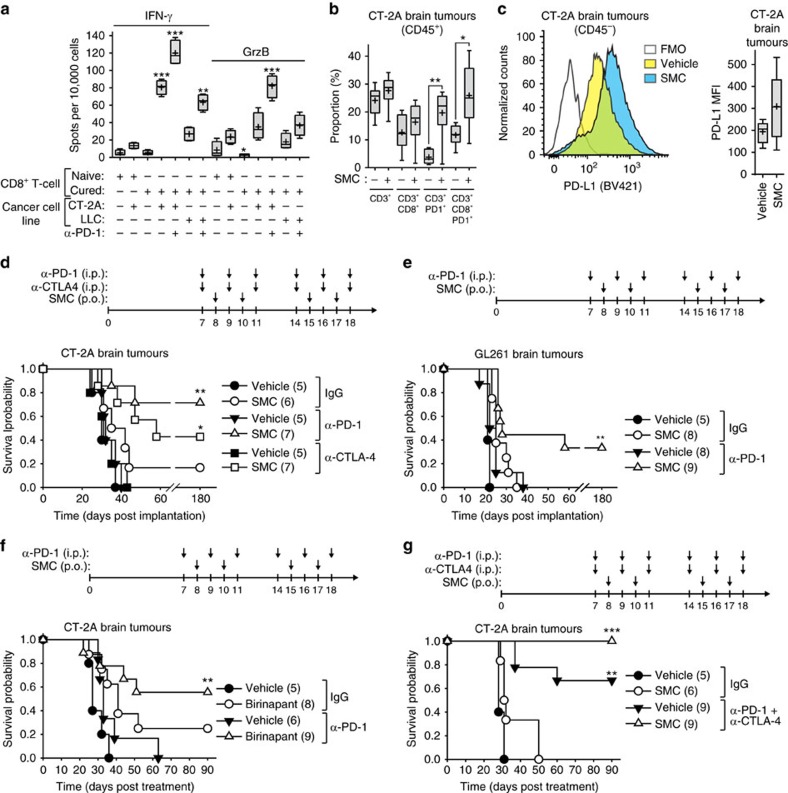
Figure 4. SMCs synergize with antibodies targeting immune checkpoints in mouse models of glioblastoma.
(a) Splenic CD8+ T-cells were enriched from naive mice or mice previously cured of CT-2A tumours, and subjected to ELISpot assays for the detection of IFN-γ and GrzB. Cancer cells (CT-2A, LLC) were cocultured with CD8+ cells (25:1 ratio) and 10 μg ml−1 of control IgG or α-PD-1 for 48 h. n=4 of mice per group. Significance was compared with naive CD8+ T-cell co-incubated with CT-2A cells as assessed by ANOVA with Dunnett’s multiple comparison test. *P<0.05; **P<0.01; ***P<0.001. (b) Mice bearing intracranial CT-2A tumours were treated with 75 mg kg−1 LCL161 orally (SMC) on post-implantation day 14, 16, 21 and 23. Viable cells from tumour masses were analysed by flow cytometry for the detection of CD45 (BV605), CD3 (APC-Cy7), CD8 (PE) and PD-1 (BV421). Representative plots are shown in Supplementary Fig. 6. Statistical significance for each pair was assessed by a t-test. *P<0.05; **P<0.01. (c) Viable tumour cells from the experiment in b were analysed by flow cytometry using the antibodies CD45 (PE) and PD-L1 (BV421). n=6 of mice per group. FMO, fluorescence minus one. Statistical significance was assessed by a t-test. (d–g) Mice bearing intracranial CT-2A (d,f,g) or GL261 (e) tumours were treated at the indicated times with combinations of vehicle, 75 mg kg−1 LCL161 orally (d,e,g) or vehicle or 30 mg kg−1 Birinapant i.p. (f) and 250 μg of IgG, α-PD-1 or α-CTLA-4 (i.p.) or both combined (g). Data represent the Kaplan–Meier curve depicting mouse survival. Log-rank with Holm–Sidak multiple comparison: *P<0.05; **P<0.01; ***P<0.001. Numbers in parentheses represent number of mice per group. (a–c) Crosses depict mean, solid horizontal lines depict median, boxes depict 25th to 75th percentile, and whiskers depict min–max range of the values. (d) Representative data from two independent experiments.

