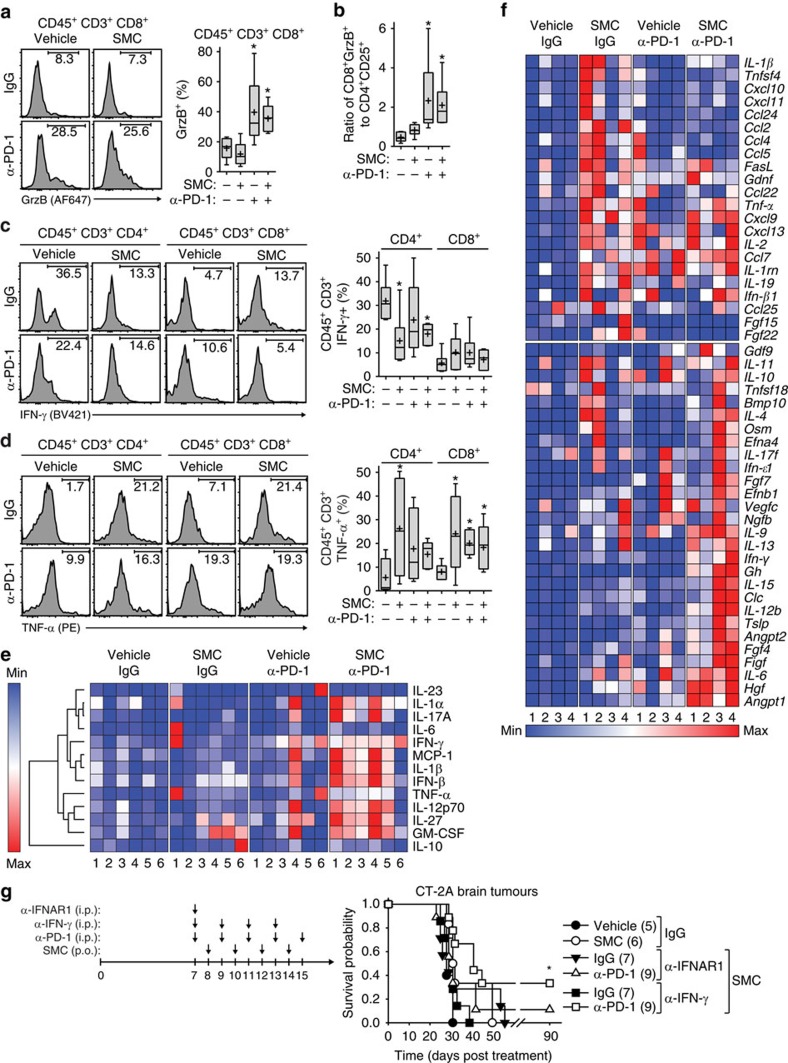
Figure 7. SMC and immune checkpoint inhibitor combination induces a proinflammatory cytokine response and efficacy is dependent on type I IFN.
(a–d) Mice were treated as in Fig. 6a, and viable cells from brain tumours were isolated and processed for flow cytometry using the following antibodies: CD45 (BV605), CD3 (APC-Cy7), CD4 (PE-Cy7), CD8 (BV786/0), IFN-γ (BV421), TNF-α (PE) and GrzB (AF647). Crosses depict mean, solid horizontal lines depict median, boxes depict 25th to 75th percentile, and whiskers depict min–max range of the values. Significance was compared with vehicle and IgG-treated mice as assessed by ANOVA with Dunnett’s multiple comparison test. *P<0.05. n=6 for each treatment group. (e) Serum from mice depicted in Fig. 6a was processed for multiplex ELISA for the quantitation of the indicated proteins. Data are plotted as heat maps using normalized scaling. Representation of the same data as box and whisker plots is in Supplementary Fig. 14. n=6 for each treatment group. (f) Mice were treated as in Fig. 6a and intracranial CT-2A tumors were processed for quantitation of 176 cytokine and chemokine genes by RT-qPCR. Shown are normalized heat maps of two major groups identified by hierarchical clustering. The complete hierarchical cluster profiles are in Supplementary Fig. 15. n=4 for each treatment group. (g) Mice bearing intracranial CT-2A tumours were treated at the indicated post-implantation day with vehicle or 75 mg kg−1 LCL161 (oral) or i.p. with the relevant isotype IgG control or 2.5 mg α-IFNAR1, 350 μg α-IFN-γ or 250 μg α-PD-1. Data represent the Kaplan-Meier curve depicting mouse survival. Log-rank with Holm-Sidak multiple comparison: *P<0.05. Numbers in brackets denote the size of the treatment groups.

