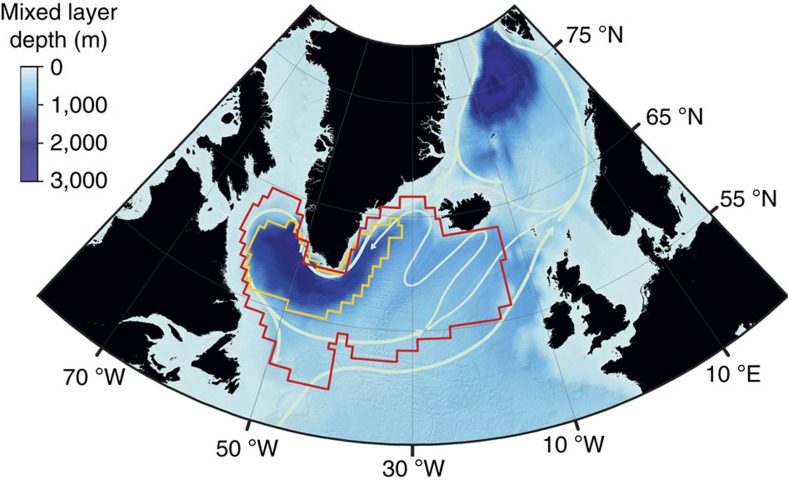
Figure 1. Sites of deep-water formation in the North Atlantic.
Map of the maximum winter mixed layer depth (m) averaged over the 1993–2012 period according to the GLORYS reanalysis. The red contour represents the reference area for our analysis (see Methods). Its total surface measures 3.61 × 10⁶ km2 and it entirely spans the subpolar NA, including those sites in the Labrador and Irminger Seas that are regularly subject to convective activity. The yellow contour highlights the region for which the maximum MLD averaged over the 1993–2012 period exceeds 1,000 m. This area has been used for a sensitivity test of our main findings on the particular choice of the reference region (Supplementary Fig. 9). Arrows indicate the main surface currents, including the North Atlantic Current, the western subpolar gyre in the Labrador and Irminger Seas and the eastern subpolar gyre in the Nordic Seas.

