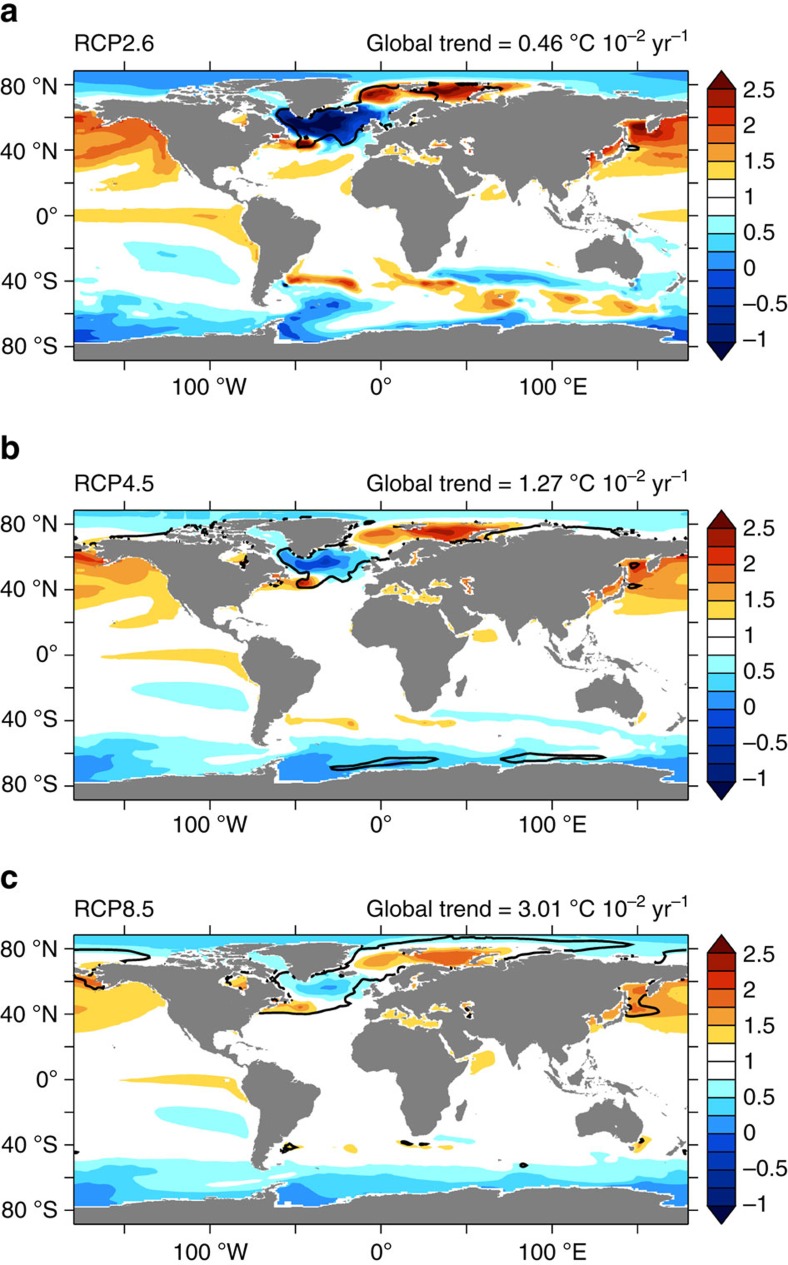
Figure 2. Patterns of SST response in RCP scenarios.
Ensemble mean of the 21st century SST trend normalized by its own global mean (dimensionless quantity) for (a) RCP2.6 simulations, (b) RCP4.5 simulations and (c) RCP8.5 simulations. The globally averaged SST trend ensemble mean is indicated for each scenario, that is, 0.46 10−2 oC year−1 for the RCP2.6 experiments, 1.27 10−2 oC year−1 for the RCP4.5 experiments and 3.01 10−2 oC year−1 for the RCP8.5 experiments. Since the globally averaged SST trend ensemble mean is positive for all scenarios, the non-dimensional value in each grid point is >1 when characterized by amplified warming, <1 when characterized by a subdued warming and <0 when characterized by cooling. The black contour shows regions with maximum ensemble spread (see Methods).

