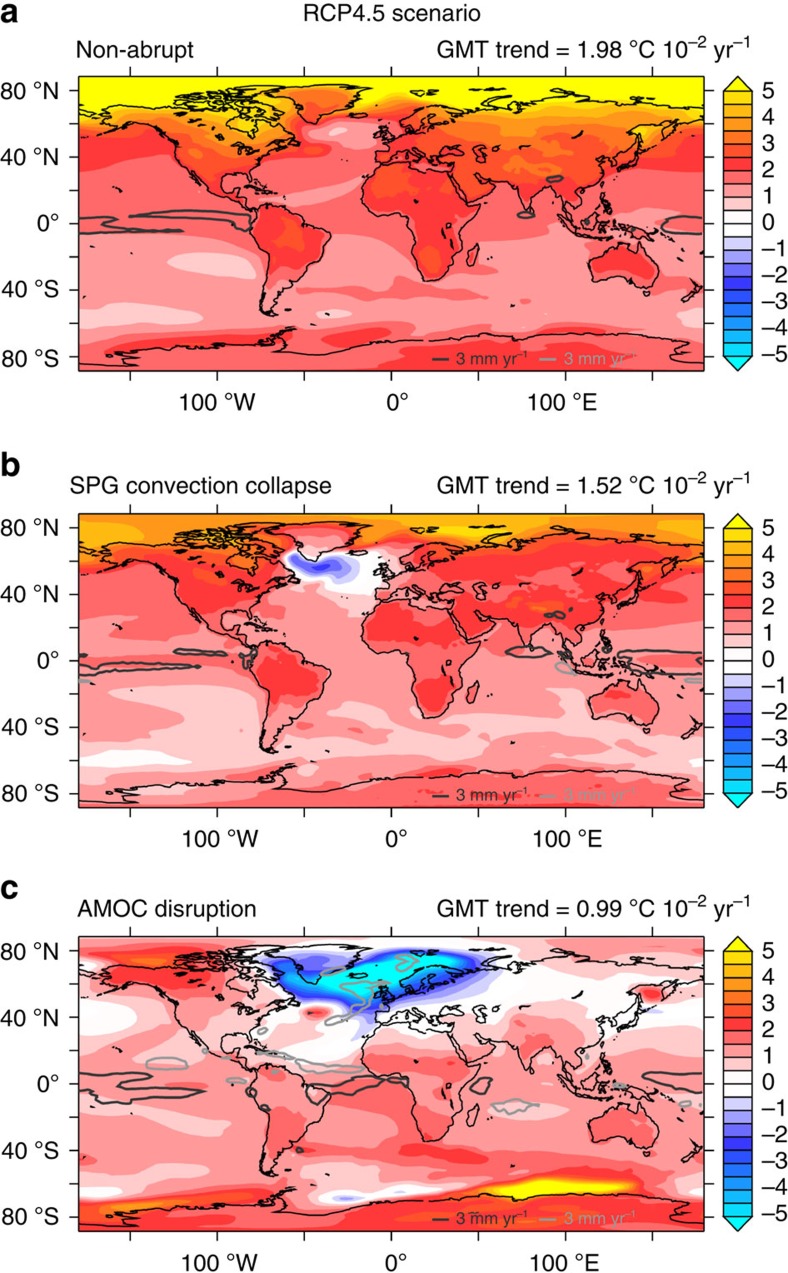
Figure 4. Different climate impacts.
Patterns of the 21st century SAT trend (oC 10−2 year−1) under the RCP4.5 scenario for: (a) non-abrupt ensemble (27 members), (b) SPG convection collapse ensemble (7 members) and (c) AMOC disruption ensemble (2 members). The GMT trend is also displayed for each subset. The light grey and dark grey contours define regions where the ensemble mean precipitation trend, respectively, exceeds 300 mm per century and is lower than −300 mm per century. Results for the RCP2.6 and RCP8.5 scenarios can be found in Supplementary Fig. 7 and Supplementary Fig. 8.

