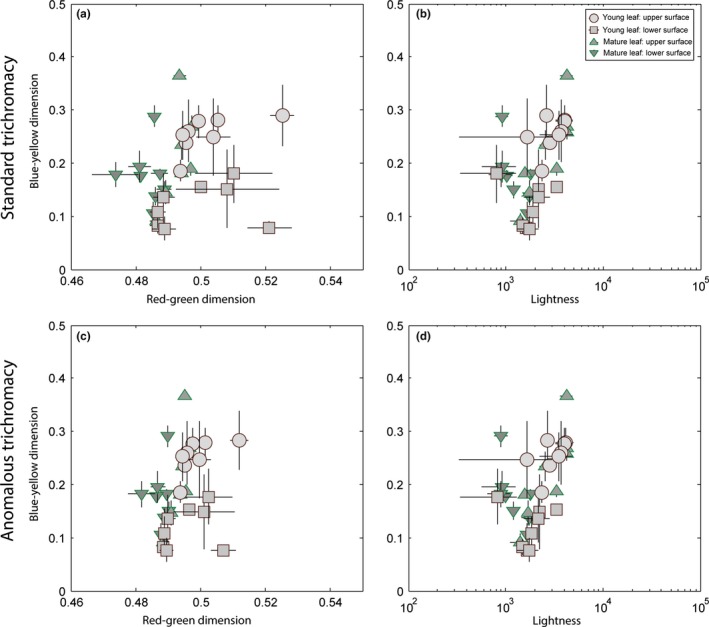
Figure 3.

Chromaticity and luminance plots of eight dietary species. Chromaticity values show the color distance for (a) the standard trichromat phenotype and (b) the anomalous color vision phenotype along the red‐green color dimension (x‐axis; L/(L + M)) and along the blue‐yellow dimension (y‐axis; S/(L + M)). Greater values along the x‐axis indicate redder coloration, and greater values along the y‐axis indicate bluer coloration. Luminance values (x‐axis; log(L + M)) are plotted against the blue‐yellow chromatic axis (y‐axis) for (c) the standard trichromat phenotype and (d) the anomalous color vision phenotype. Lighter gray data points plot young leaves (circles—upper surface, squares—lower surface), and darker gray triangles plot mature leaves. Upper mature leaves are marked by upward facing triangles, lower mature leaves are marked by downward facing triangles
