
Figure 1. Angiotensin II reduces total and surface KV1.5 channel protein through protein kinase C (PKC) activation in mesenteric arteries.
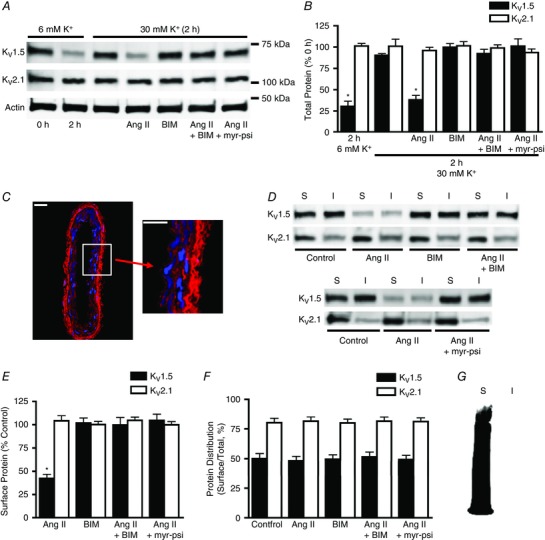
A, representative Western blot images of total arterial KV1.5, KV2.1 and actin protein at 0 or 2 h in 6 mm K+ physiological saline solution (PSS), 30 mm K+ PSS, or 30 mm K+ PSS with angiotensin II (Ang II; 100 nm), bisindolylmaleimide (BIM; 10 μm), Ang II plus BIM, or a myristoylated PKC inhibitory peptide (myr‐psi; 100 μm). B, mean data. n = 6 for each. * P < 0.05 vs. 0 h. C, immunofluorescence of a section cut from a biotinylated mesenteric artery labelled with Alexa Fluor 546 streptavidin (red) and DAPI (blue), a nuclear stain. Scale bars represent 20 μm. D, representative Western blot images of arterial biotinylation samples illustrating surface (S) and intracellular (I) KV1.5 and KV2.1 following 2 h in 30 mm K+ alone (control) or in the presence of Ang II (100 nm), BIM (10 μm), Ang II plus BIM, or Ang II plus myr‐psi (100 μm). E, mean data for surface protein in conditions from experiments shown in C calculated as a percentage of control surface protein. n = 6 for each. * P < 0.05 vs. control. F, quantitative analysis of the relative cellular distribution of total KV1.5 and KV2.1 protein in conditions from C calculated as the percentage of total protein located at the cell surface. n = 6 for each. G, representative image of a Western blot probed with horseradish peroxidase‐conjugated avidin, illustrating that the avidin bead pull‐down procedure is 100% efficient and that no biotinylated proteins are present in the non‐biotinylated protein fraction.