
Figure 6.
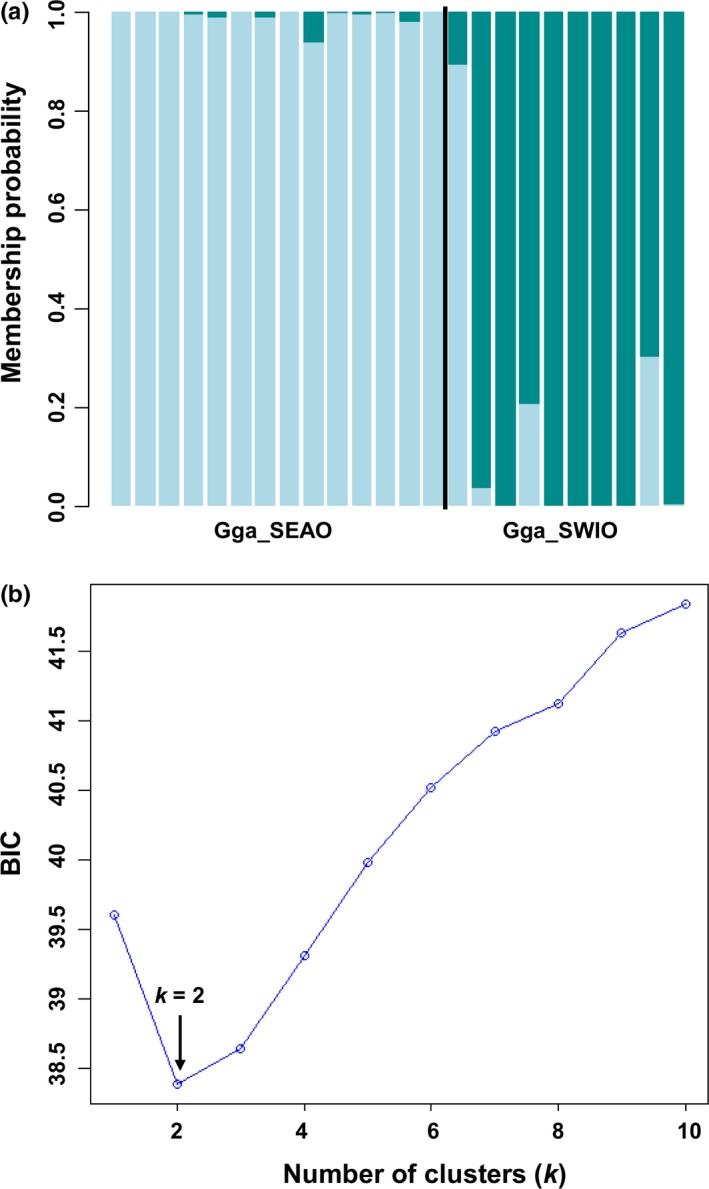
STRUCTURE‐like plot, inference of the number of clusters, and scatterplots of DAPC analysis on the dataset of Galeorhinus galeus. Gga_SEAO and Gga_SWIO represent the South African Southeast Atlantic and Southwest Indian Ocean sampled populations, respectively. (a) Cluster assignments by population (sampling location a priori), each individual is represented by a vertical colored line. (b) Inference of the number of clusters excluding sampling location as a priori. A k value of 2 (the lowest BIC value) represents the best summary of the data. Each color represents a genetic cluster (k)