
Figure A4.
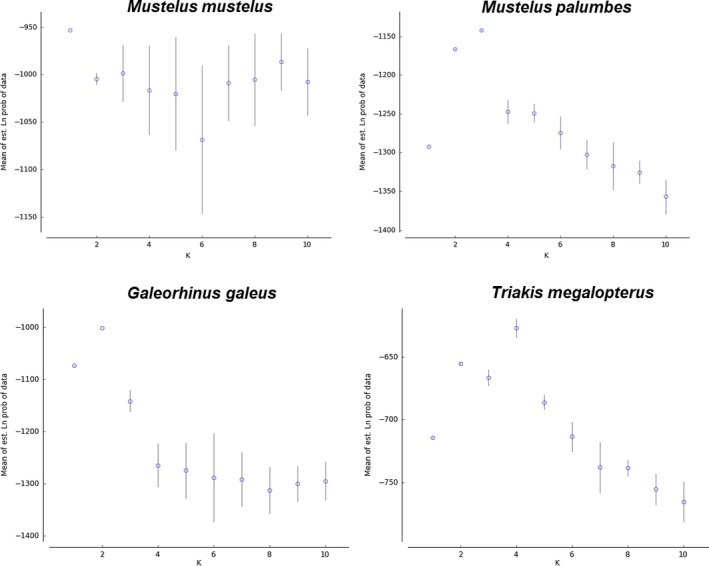
Likelihood probability profile estimated from STRUCTURE at K1‐10 showing the mean and variance at each K for each study species.
Official websites use .gov
A
.gov website belongs to an official
government organization in the United States.
Secure .gov websites use HTTPS
A lock (
) or https:// means you've safely
connected to the .gov website. Share sensitive
information only on official, secure websites.
Likelihood probability profile estimated from STRUCTURE at K1‐10 showing the mean and variance at each K for each study species.