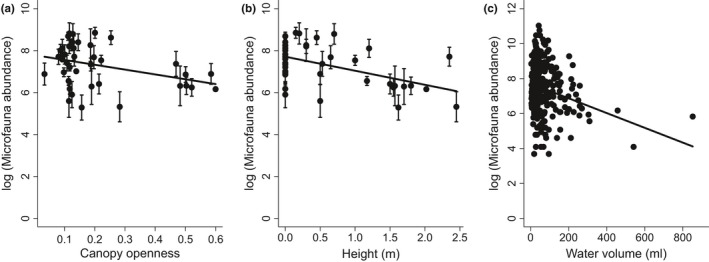
Figure 4.

Mean log‐transformed microfauna abundance in bromeliads declines with (a) canopy openness (measured as a proportion of visible sky, where 1 represents completely open and 0 means completely closed canopy), with (b) height of bromeliads above the ground, and with (c) water volume. Data points in (a) and (b) represent mean values for each bromeliad ± 1 standard error, and measurements from all phytotelmata are shown in panel (c)
