
Figure 6.
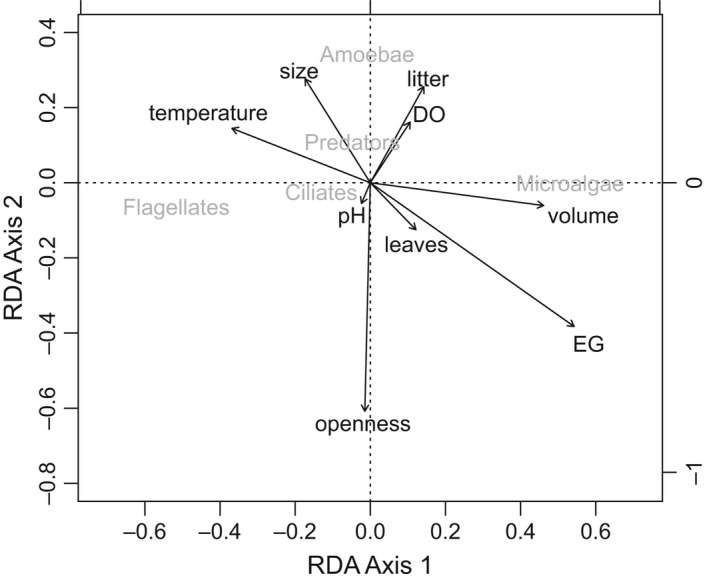
Redundancy analysis (RDA) showing the effect of environmental variables (black) on the Hellinger‐transformed abundances of the main microfauna groups (dark gray) after accounting for the sorter effect and position of individual communities within bromeliads. Canopy openness (proportion of visible sky above each bromeliad), water volume, elevation above ground (EG), and temperature (the longest vectors) were the four variables explaining a significant proportion of the functional group variance (adj. r2: .135, p < .05). DO represents dissolved oxygen in the water