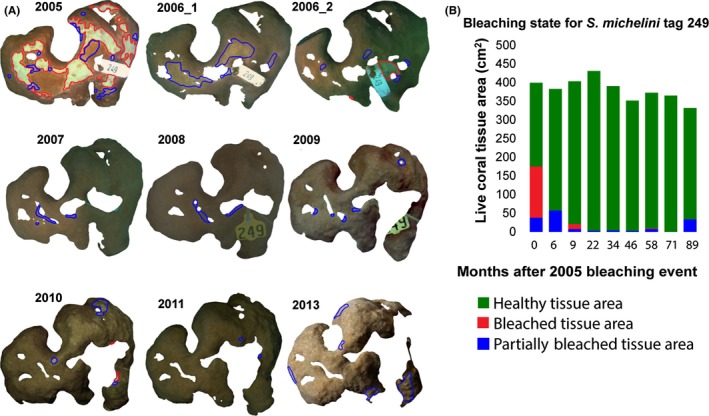
Figure 3.

Segmented live coral tissue areas for a single example colony from 2005 to 2013. (A) Healthy pigmented portions of live tissue area are screened from the color‐corrected background images and outlined in green, with partially bleached tissue in blue and bleached areas in red. Some interannual differences in image color are due to water conditions, lighting, or camera sensitivities. (B) Bar plot shows changes in bleaching state across the time frame of the study for this colony. This example colony (Tag #249) did not demonstrate massive tissue loss, recovering quickly from significant bleaching in 2005, but did experience long‐term patchy tissue mortality, largely localized to previously bleached areas
