
Figure 5. Causal relations between the hippocampal LFP activity and the NI neurons.
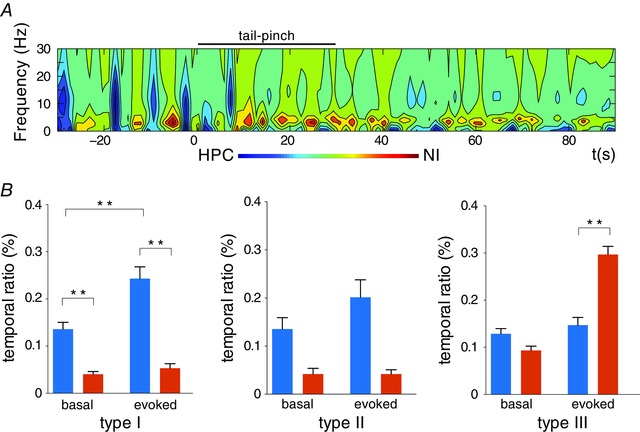
A, time–frequency representation of the causal relation between the HPC and type III NI neurons; representative case. B, the temporal ratio statistics with the causal significance for each neuronal type, for both causal directions (blue for HPC→NI; orange for NI→HPC) and for each experimental state (basal and evoked states). * P < 0.05 and ** P < 0.01. [Colour figure can be viewed at wileyonlinelibrary.com]