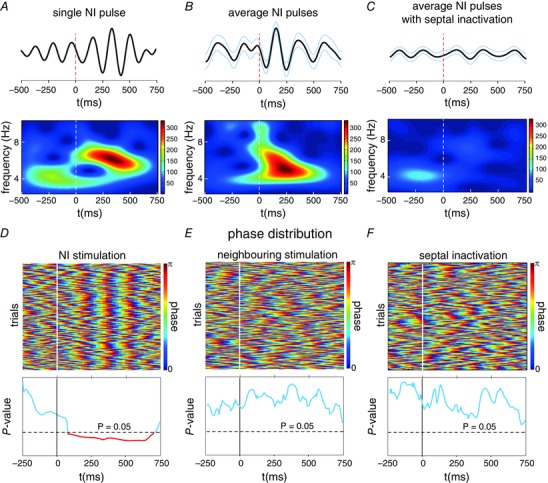
Figure 6. Phase‐reset analysis of the hippocampal wave after electrical stimulation on the NI.

A, wavelet spectrogram of a hippocampal LFP single trial (bottom) and the filtered signal within the theta range (top), with the theta increase shown after the electrical pulse. B, average filtered signal (top) and spectrogram (bottom) for all trials during an experimental session. As in a single pulse, a characteristic theta increase can be visualised as an effect of the electrical pulses in the NI. C, average filtered signal (top) and spectrogram (bottom) for all the trials during an experimental session after MS/DBv inactivation by muscimol infusion. Vertical dashed lines represent the electrical pulse in the NI and blue lines the SEM of the average signal. D, top, single‐trial phase resetting evoked by the electrical pulses in the NI. Each horizontal line reflects the phase distribution of the theta‐filtered hippocampal signal. Warm colours represent the phase peak at 180 deg. Bottom, Rayleigh's test of the phase distribution in the time domain for all trials during the same recording session. The horizontal dashed line is indicative of the threshold for statistical significance (P < 0.05). The values below the significance level (in red) were considered to define the phase‐locking epoch between trials, and allowed the detection of the onset of reset. E, phase‐trial representation (top) and Rayleigh's P‐values (bottom) with the electrical stimulation in neighbouring areas of the NI. F, phase‐trial representation (top) and Rayleigh's P‐values (bottom) with the inactivation of the MS. [Colour figure can be viewed at wileyonlinelibrary.com]
