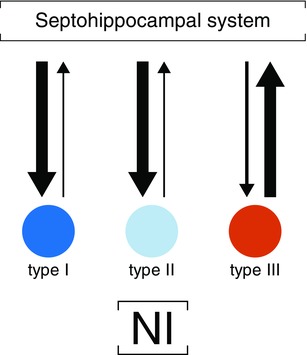
Figure 7. Schematic diagram of the causal interactions among the NI neurons and the septo‐hippocampal system.

Arrow thickness reflects the main causal flow during hippocampal theta periods. [Colour figure can be viewed at wileyonlinelibrary.com]

Arrow thickness reflects the main causal flow during hippocampal theta periods. [Colour figure can be viewed at wileyonlinelibrary.com]