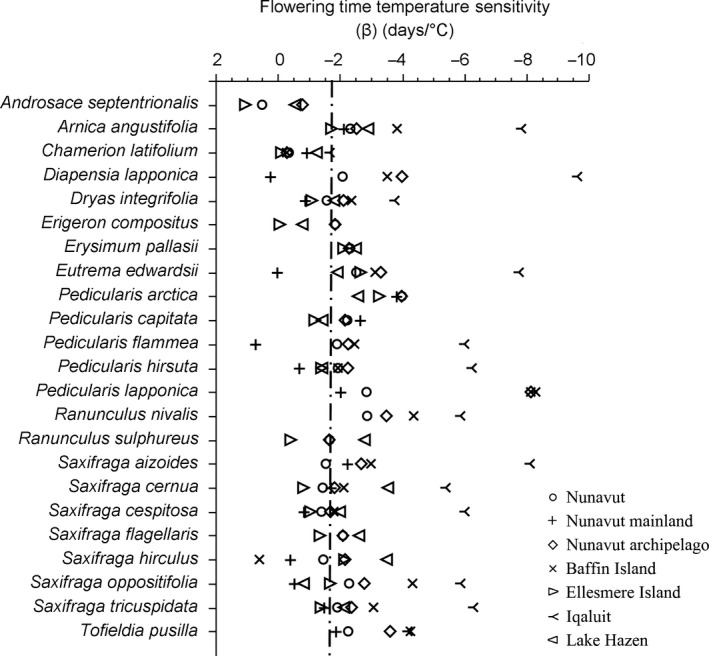
Figure 4.

Species’ flowering time temperature sensitivity (β) at different spatial scales in Nunavut, Canada. Significant sensitivity is to the right of the dashed vertical line (Table S2)

Species’ flowering time temperature sensitivity (β) at different spatial scales in Nunavut, Canada. Significant sensitivity is to the right of the dashed vertical line (Table S2)