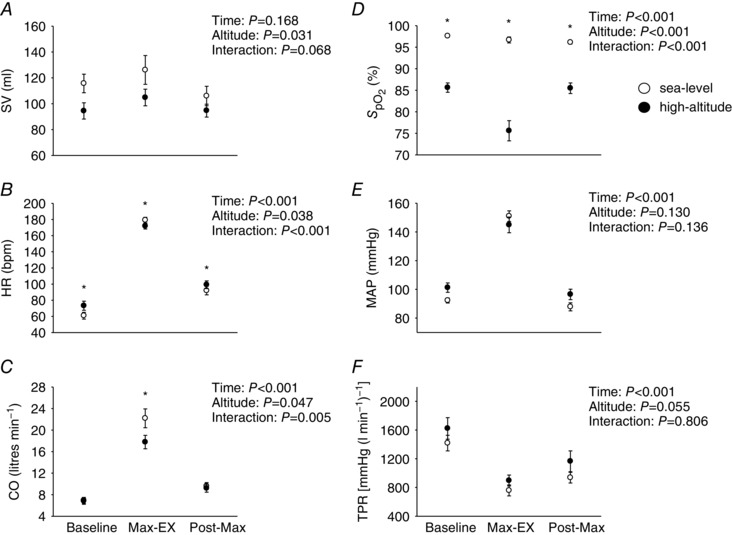
Figure 2. Cardiovascular data during baseline, maximal exercise and post‐maximal exercise at sea level and high altitude.

Open circles represent sea‐level data ± SEM, and closed circles high‐altitude data ± SEM in nine participants. * P < 0.05, for interaction effects. Statistics for main effects and interactions are displayed on the top right of each panel. BL, baseline; Max‐Ex, maximal exercise; Post‐Max, post‐maximal exercise; , per cent oxygen saturation of haemoglobin; SV, stroke volume, HR, heart rate; CO, cardiac output; MAP, mean arterial pressure; TPR, total peripheral resistance. Collectively, these findings reveal that SV, HR, CO and were all elevated at sea level compared to high altitude during a maximal exercise test.
