Figure 4.

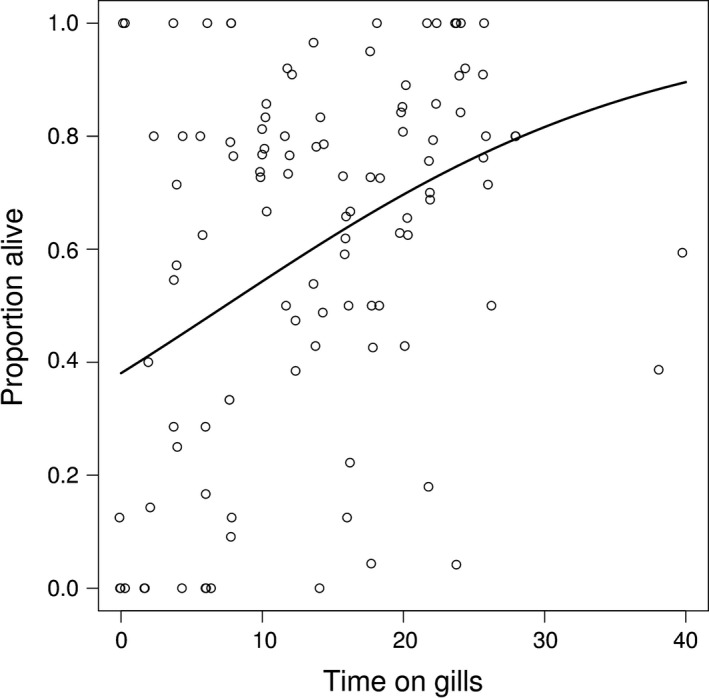
The proportion of survivors depending on the duration of the parasitic phase (time on gills). The line represents model predictions where the covariate (post parasitic age) was set to its mean

The proportion of survivors depending on the duration of the parasitic phase (time on gills). The line represents model predictions where the covariate (post parasitic age) was set to its mean