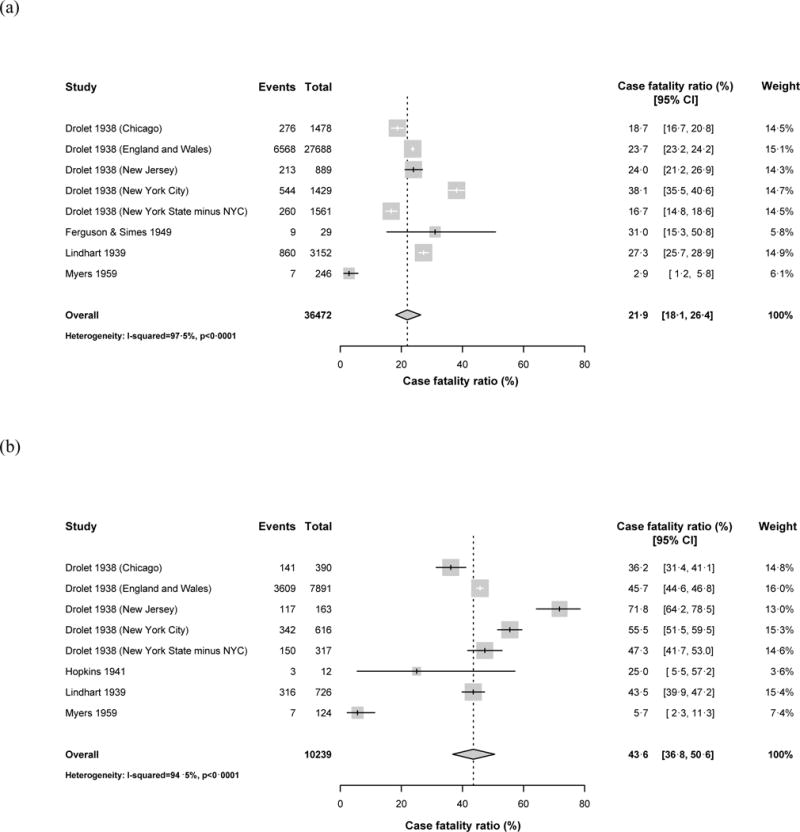
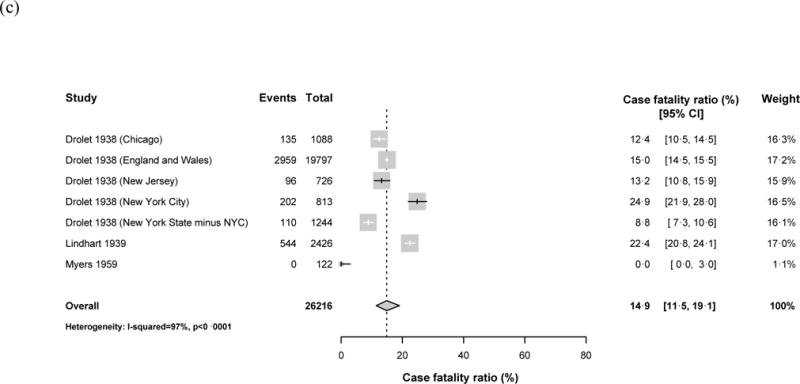
Figure 3.


Forest plots for the case fatality ratios from studies in the pre-treatment era. Results are shown for (a) children aged 0–14 years, (b) children aged <5 years old, (c) children aged 5–14 years old. Horizontal lines represent the confidence intervals around the point estimates for each study and the grey shaded areas are proportional to the weight given to each study.
