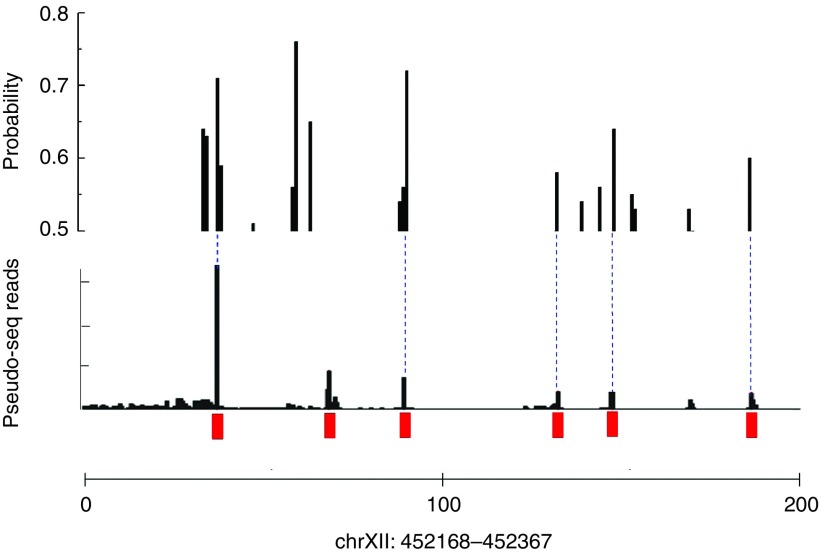
Figure 2.
A comparison between predicted results of iRNA-PseU and experimental results on a 200-nt (from 452168 to 452367) genomic region of chromosome XII from S. cerevisiae. The top panel shows the probability values calculated by iRNA-PseU. The middle panel shows the experimental results determined by using the Pseudo-Seq technique, where the six known Ψ sites are highlighted with red rectangles.7 The dashed blue line shows the consistency between the predicted result and the experimental one. The lower panel shows the relative genomic coordinate.

