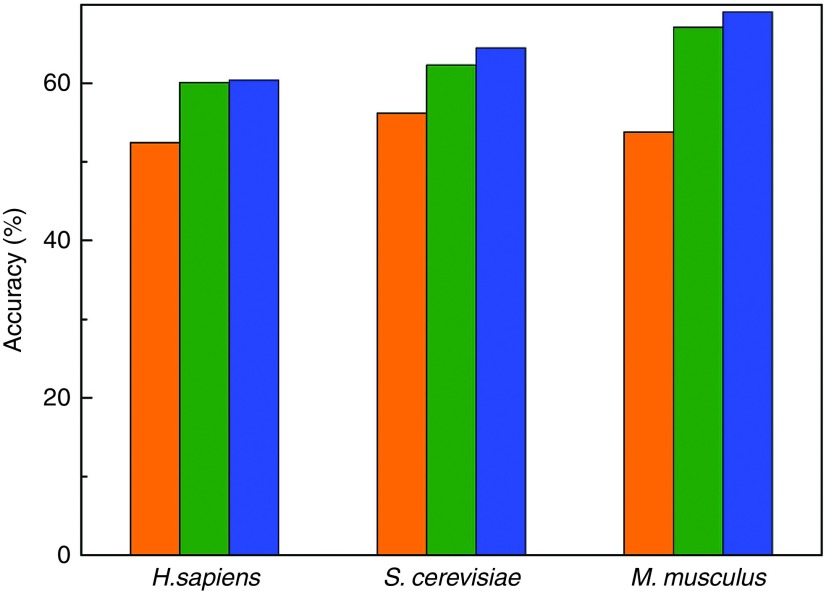
Figure 4.
An in-depth analysis into the contributions of three models: the orange histogram stands for the accuracy score obtained by the model trained based on the nucleotide density in identifying Ψ sites; the green one for that based on the nucleotide chemical properties; and the blue for that by combing the above two models. See the text for more explanation.

