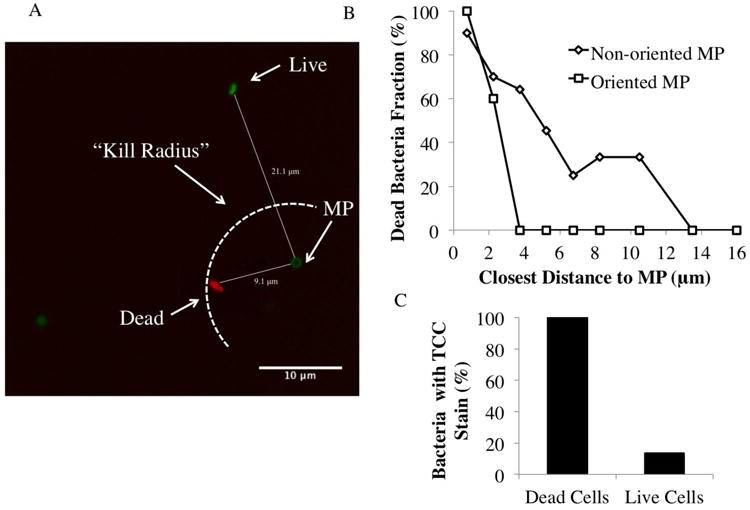
Fig 6.

Confocal imaging of microparticle/microparticle interaction (A). The image shows a red dead stain, green live stain, and dark green MP stain. DH5α E. Coli and 1 μm non-oriented microparticles (2:1 Fc density) were imaged. The arc indicates a theoretical “kill radius” inside which complement-mediated lysis is greatest. Relating bacterial death and distance to closest microparticle (B) This plot shows the percentage of bacteria that are dead at various distances from individual microparticles, comparing the non-oriented MP (triangles) and oriented MP (squares). Two way ANOVA was performed and showed a significant difference between non-oriented and oriented effect on serum cytotoxicity (overall p-value (prob>F)=0.0012, and p-value(prob>t) = 0.0463 for effect of oriented vs. non-oriented). Accuracy of TCC stain (C) The bar chart shows the percentage of dead cells linked to the TCC stain, and the percentage of live cells paired to a TCC stain.
