
Figure 2.
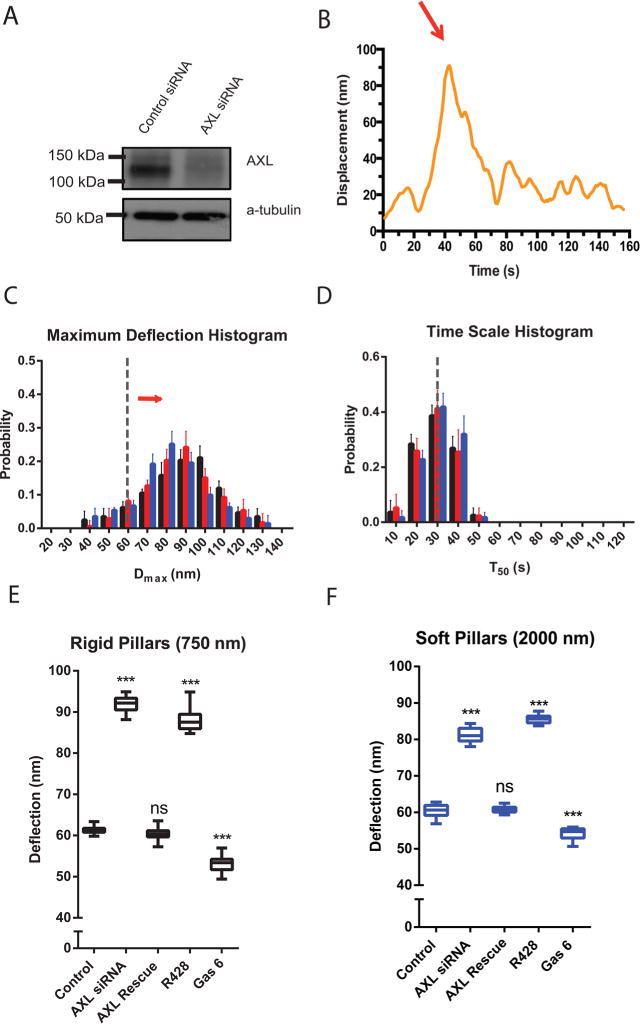
Knockdown of AXL increases the displacement. (A) AXL level is knocked down in Western blots of control siRNA vs AXL siRNA transfected cells. (B) Displacement vs time of a single pillar in a contractile unit under an AXL knockdown cell. (C) Histograms of Dmax values for AXL knockdown cells spreading on pillars of different heights. Black represents 750 nm high pillars, red for 1500 nm high pillars, and blue for 2000 nm high pillars. Error bars denote SDs of the percentages from 10 different cells in 3 independent experiments. The gray line highlights the control histogram peak at Dmax = 60 nm. The red arrow indicates the shifting of AXL knockdown histogram distribution. (D) Histograms of T50 values for AXL knockdown cells spreading on pillars of different heights. (E and F) Box-and-whisker plots of median values of Dmax for similarly treated cells on rigid pillars (E) and soft pillars (F) (n = 10 in each case; ***p < 0.001).