
Figure 3.
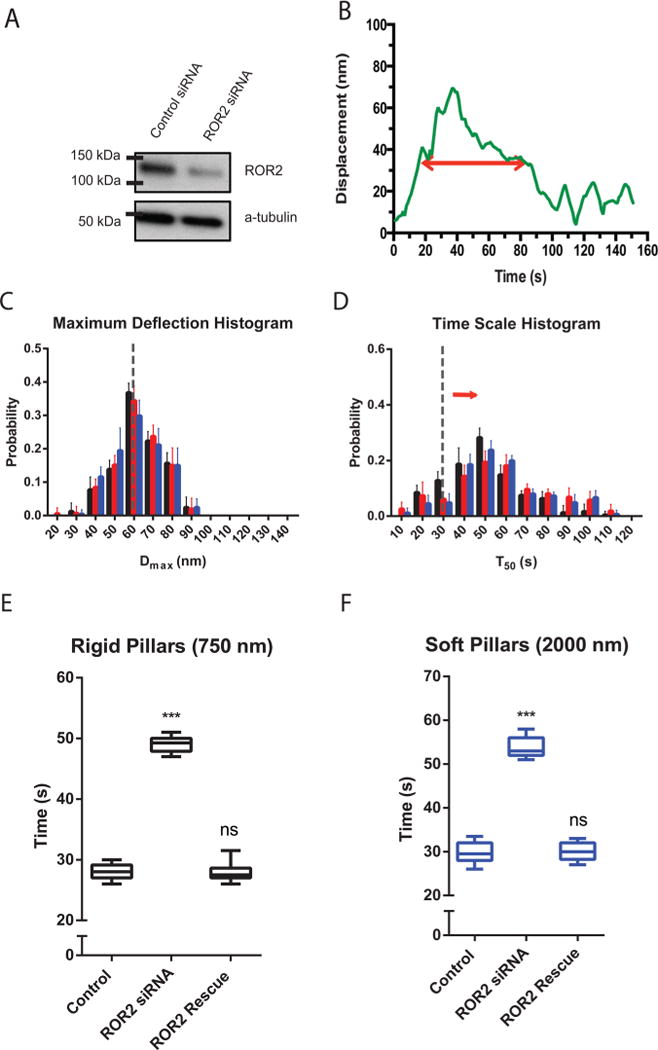
ROR2 silencing increases the duration of contractions, not length. (A) ROR2 level is knocked down in Western blot of ROR2 siRNA vs control siRNA transfected cells. (B) Typical displacement vs time of a single pillar under a ROR2 knockdown cell. (C) Histogram plots of Dmax values for ROR2 knockdown cells spreading on pillars of three different heights. (D) Histogram plots of T50 values for ROR2 knockdown cells spreading on pillars of three different heights. Black represents 750 nm high pillars, red for 1500 nm high pillars, and blue for 2000 nm high pillars. Error bars denote SDs of the percentages from 10 different cells in 3 independent experiments. (E and F) Box-and-whisker plots of median values of T50 distributions for similarly treated cells on rigid pillars (E) and soft pillars (F) (n = 10 in each case; ***p < 0.001).