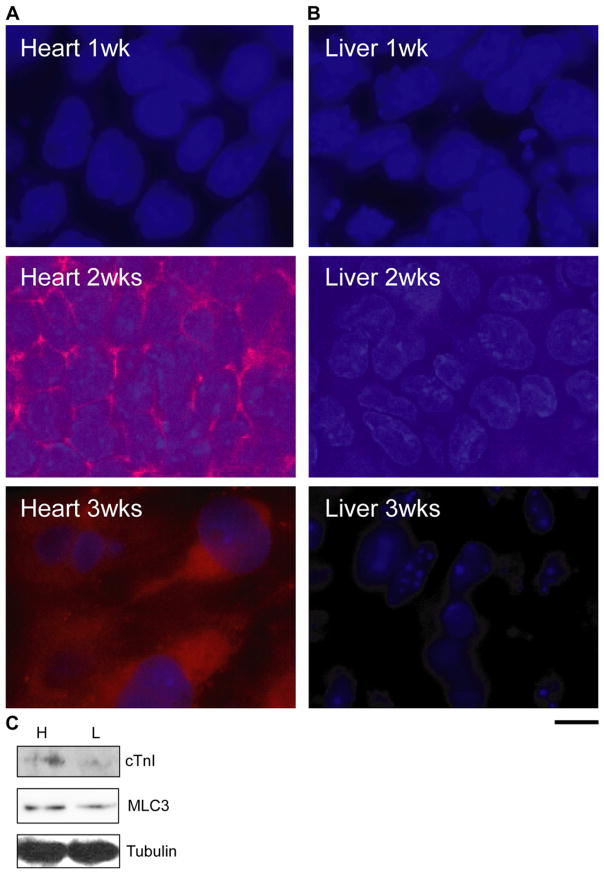
FIG. 4.
Protein expression of cardiac genes examined in cells cultured on different matrices. (A) ES cells cultured on the heart ECM for 1, 2, and 3 weeks. (B) ES cells cultured on the liver ECM for 1, 2, and 3 weeks. Blue, DAPI; red, cMHC. Scale bar: 10 μm. (C) Detection of cTnI and MLC3 expression by Western blotting at 2 weeks. Abbreviations: “H”, cells on heart ECM; “L”, cells on liver ECM. Representative immunoblots from three independent experiments are shown.

