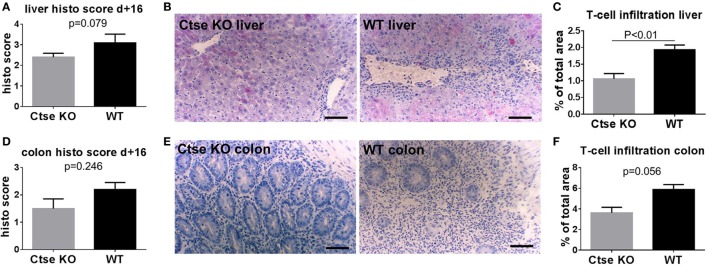
Figure 3.
Histopathological scores and T cell infiltration is reduced in cathepsin E (Ctse)−/− allogeneic hematopoietic stem cell transplantation (allo-SCT) recipients. (A,D) Score of histopathological analysis of liver and colon sections at day +16 after allo-SCT in wild-type (WT) vs. Ctse−/− allo-SCT recipients. (B,E) Examples of H + E stainings of liver and colon sections from Ctse−/− vs. WT allo-SCT recipients. (C,F) Analysis of T cell infiltration into liver and colon at day +16 after allo-SCT, measured by labeled lymphocyte immunofluorescence area of total liver area or total colon mucosal area in WT and Ctse−/− allo-SCT recipients at day +16. n = 5 for all experiments. For immunofluorescence T cell infiltration analysis, six pictures per animal were taken. Bright-field images were taken using a Motic BA410 microscope with a Moticam Pro 285B and the Motic Images Plus 2.0 software. The used objective was a Plan Fluar 20×/0.50. Error bars indicate mean ± SEM, p-values were calculated using Wilcoxon–Mann–Whitney rank sum test. Bar = 100 μm.

