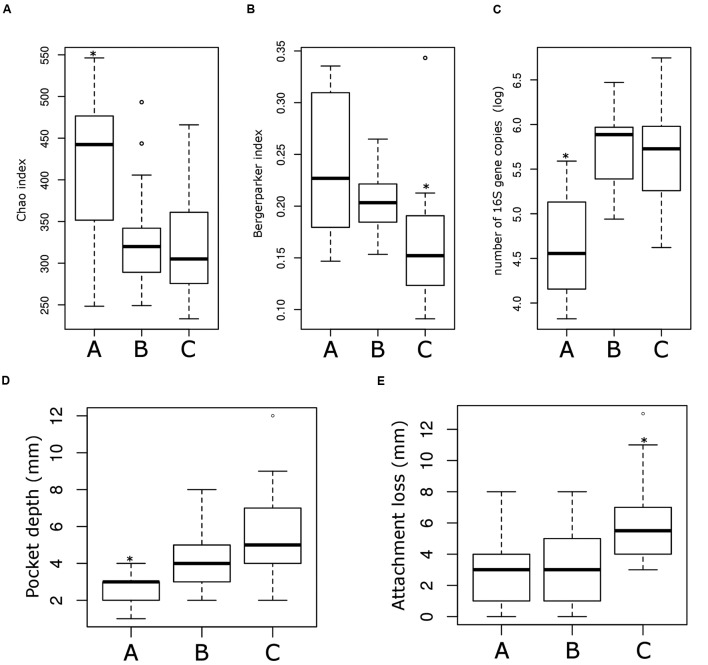
FIGURE 5.
Microbiological and clinical differences among the ecotype 2. Bar plots showing the difference between the three sub-ecotypes A, B, and C regarding richness (Chao index) (A), dominance (Bergerparker index) (B), biomass (Log of the number of 16S rRNA gene copies) (C), PD at the sampling site (D) and the AL at the sampling site (E). Pairwise comparisons were tested using t-test or Wilcoxon test as appropriate with a Bonferroni correction; significance is indicated by a star (∗).

