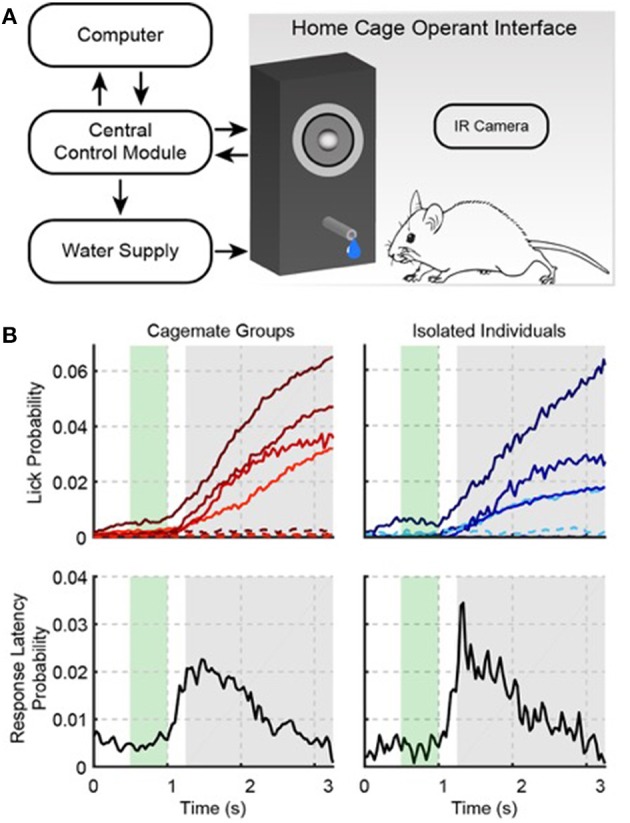
Figure 1.

The Psibox: an automated operant conditioning system. (A) Schematic of training components. (B) Auditory task performance in groups (left) and for isolated individual mice that were trained in groups (right). The top row shows the probability of a lick occurring at a given time during a trial (i.e., the “lick rate”). Each color line in the top row indicates a different cage (left) or mouse (right). Solid and dotted lines indicate responses during tone and catch trials, respectively. Catch trials were interleaved with stimulus trials, and used to estimate false alarms. The bottom row shows the first-lick latency distribution collapsed across cages (left) and isolated individuals (right). The green area indicates when the tone was presented during a trial. The gray area shows the behavioral response time-window. Licks during the response time-window were rewarded with water. Licks before the response time-window were punished with a time-out.
