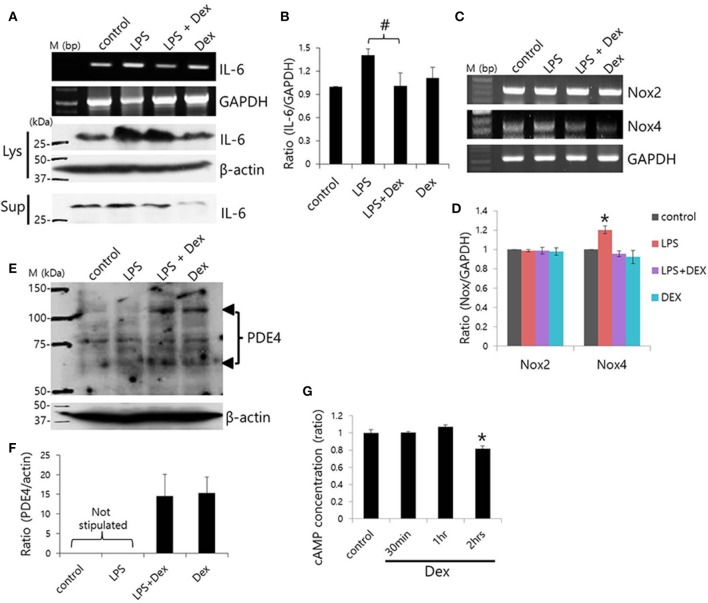
Figure 7.
Dex-induced inhibition of LPS-induced inflammatory cytokine expression and cAMP concentration. (A) SMG cells were stimulated with LPS, treated with 100 ng/ml Dex, and then IL-6 mRNA and protein expression were measured in cell lysates (Lys) and cell supernatants (Sup). (B) Bars represent the mean ± SEM (n = 4, #p < 0.05). (C) LPS-induced Nox2 and Nox4 mRNA expression in the presence of 100 ng/ml Dex. (D) Analysis of Nox2 and Nox4 mRNA expression in the presence of the indicated components (n = 5, *p < 0.01). (E) PDE4 protein expression in LPS-stimulated SMG cells. The arrowheads indicate PDE4A and PDE4D bands at 65 and 102 kDa, respectively. (F) Analysis of PDE4 expression. Bars show the mean ± SEM (n = 4). (G) cAMP ratios in Dex-treated whole SMG cells (n = 4, *p < 0.01).

