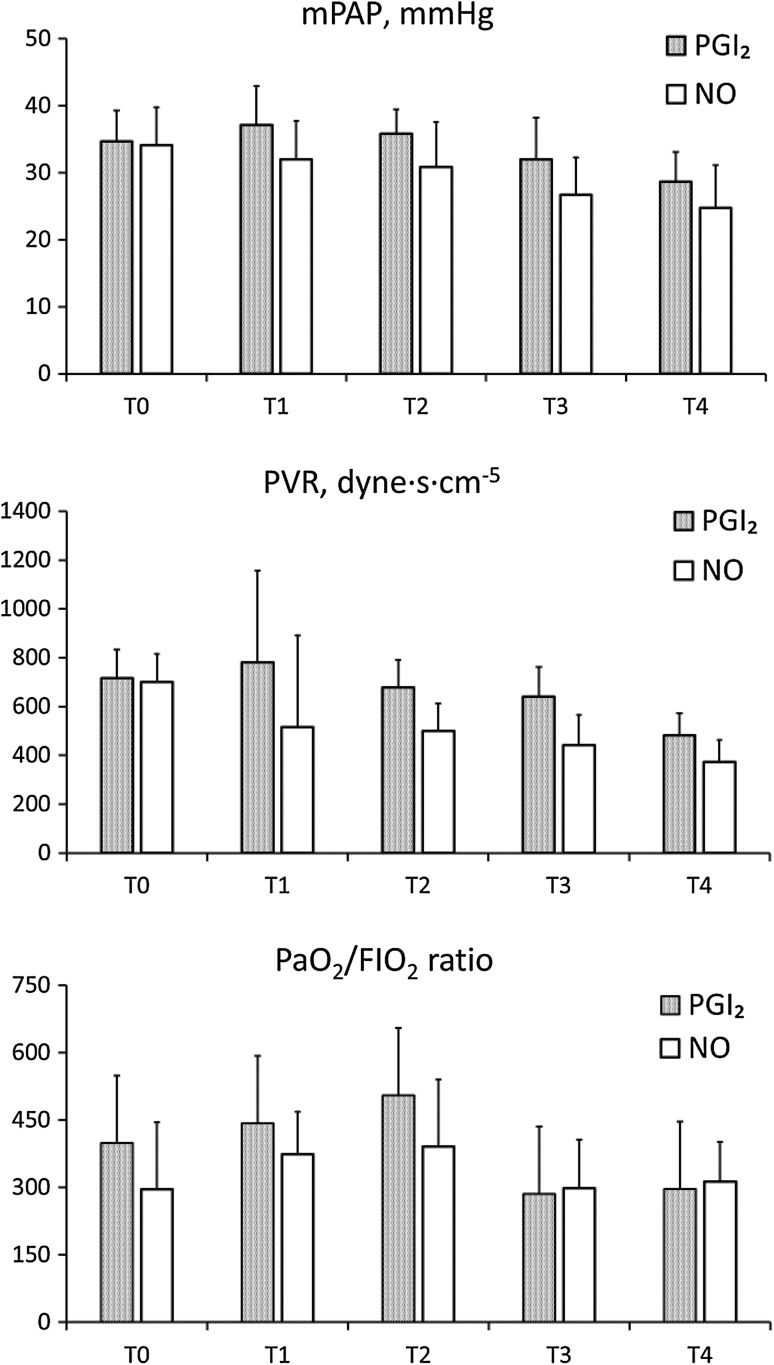
Fig. 1.
Changes in mean pulmonary artery pressure (mPAP), pulmonary vascular resistance (PVR) and ratio of arterial oxygen tension to fraction of inspired oxygen (PaO2/FIO2 ratio) at each time point in the PGI2 (mesh) and No groups (white). Variables were measured before inhalation of the agent (T0); 30 min (T1), 3 h (T2), and 6 h after inhalation (T3); and the next morning (T4)

