Fig. 11.

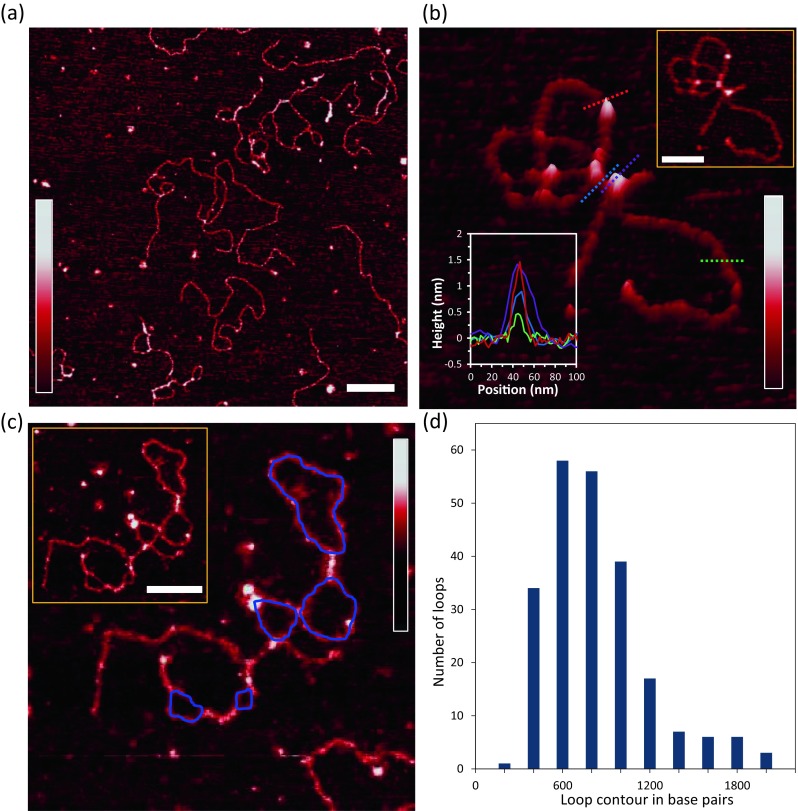
HMO1 bridges, loops and compacts DNA. a Two-dimensional representation of bridges and loops mediated by 3 nM HMO1 in the presence of 0.11 nM pBR322 DNA (scale bar 200 nm). b Three-dimensional representation of a looped single DNA molecule; the cross-sections of DNA only, DNA with protein-bound, protein bridging two DNA double helices, and two DNA double helices held close to each other by protein on its ends are shown in green, red, purple and blue, respectively. The top right inset displays a two-dimensional representation of locally probed HMO1–DNA complexes (scale bar 100 nm). Graphs of the heights (bottom-left inset) are shown for each cross-section on the image (c) Two-dimensional representation of HMO1 looping (protein-bound at the intersection of a loop) and bridging (protein-bound holding two strands close together) a DNA molecule. Traced loops are shown in blue. Inset Original AFM image without traces (scale bar 100 nm). d DNA loop sizes mediated by HMO1. The color bar in each panel represents the sample height ranging from 0.0 to 2.0 nm. (Adapted from Murugesapillai et al. 2014)
