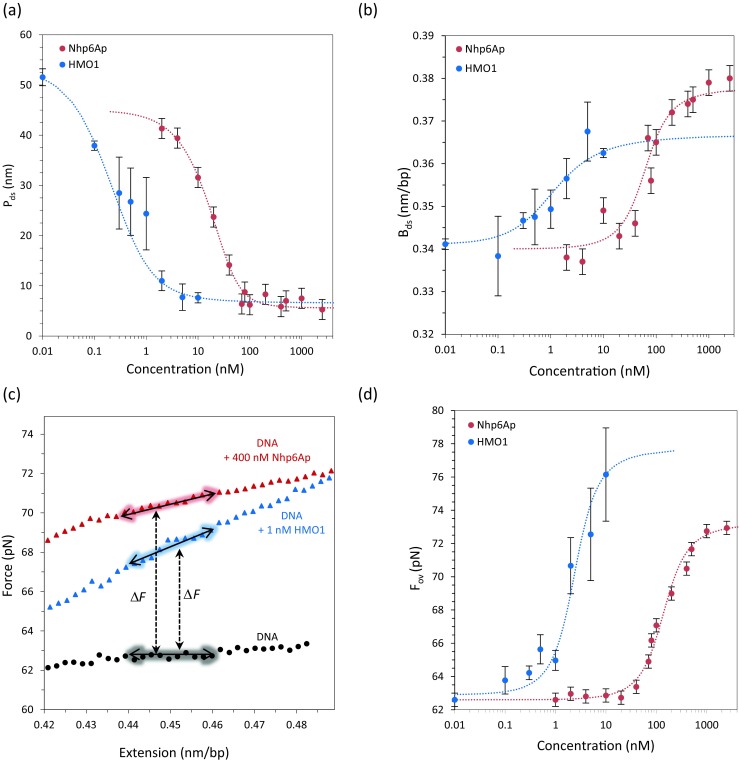
Fig. 4.

Equilibrium analysis of Nhp6A and HMO1 protein binding to DNA. a Persistence length of the DNA in the presence of Nhp6A (red) and HMO1 (blue) as a function of concentration is fitted to Eqs. 2 and 4 to obtain K D = 71 ± 14 nM and ω = 20 for Nhp6A, and K D = 2.1 ± 0.8 nM and ω = 20 ± 7 for HMO1. b Contour length of DNA in the presence of Nhp6A (red) and HMO1 (blue) as a function of concentration is fitted to Eqs. 2 and 6 to obtain K D = 71 ± 14 nM and ω = 20 for Nhp6A, and K D = 1.9 ± 0.7 nM and ω = 18 ± 5 for HMO1. c The DNA overstretching region with extensions only is shown for DNA in the absence (black circles) and presence of Nhp6A (red triangles) and HMO1 (blue triangle). (Adapted from McCauley et al. 2013; Murugesapillai et al. 2014). d Overstretching force is fitted to the site exclusion binding isotherm of Eqs. 2 and 3, yielding measurements of K D = 160 ± 20 nM and ω = 20 for Nhp6A, and K D = 2.8 ± 0.6 nM and ω = 80 ± 15 for HMO1
