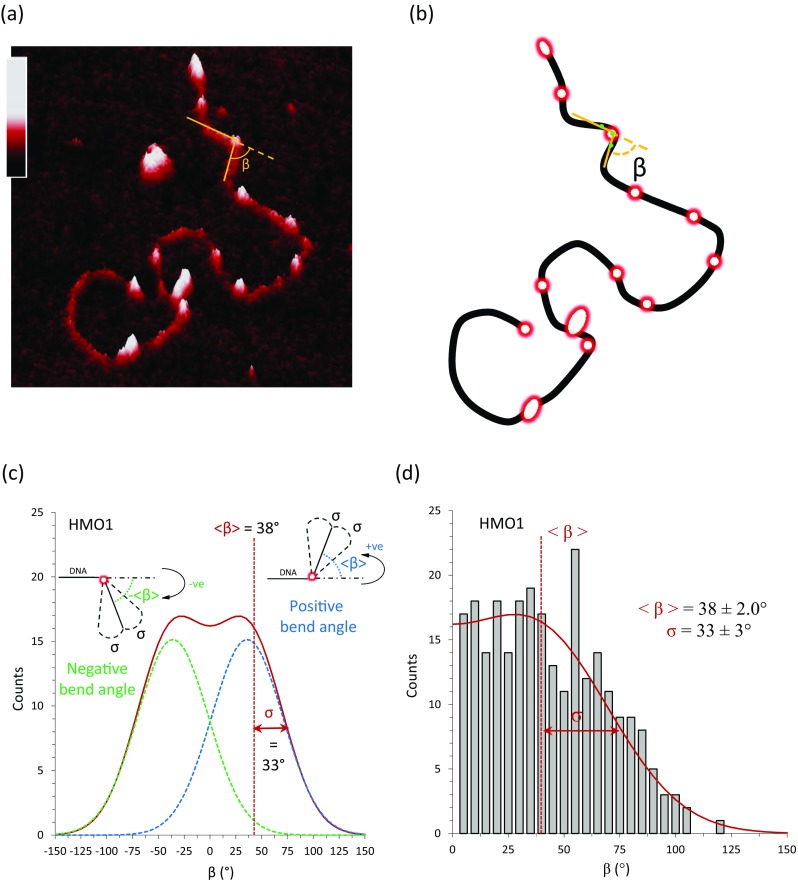
Fig. 6.

Binding of the double box HMO1 to pBR322 DNA characterized by AFM, illustrating the analysis of local DNA flexibility. a A three-dimensional AFM image of HMO1 protein bound to linearized plasmid pBR322 DNA (4361 bp). The vertical color gradient bar represents the sample height ranging from 0.0 to 2.0 nm. b Schematic diagram showing protein-bound locations from DNA only. The angle is calculated from two adjacent line segments (in gold) drawn at the location of the protein-bound site (green dots are the three equidistant points used to draw the line segments). c The measured angle could be either clockwise (positive) or counterclockwise (negative). Both directions are taken into account resulting in a bi-Gaussian fit (red), where β is the mean bend angle and σ gives the width of the distribution. d Histogram of measured local protein-induced DNA bend angles for the double box HMO1 and fit. The average measured angle is 38 ± 2.0° with σ = 33 ± 3° (Murugesapillai et al. 2014)
