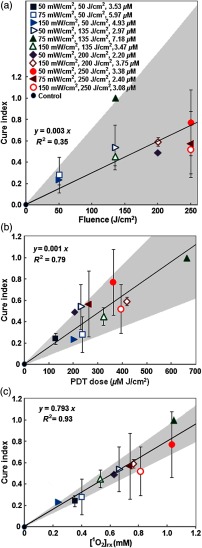
Fig. 6.
Linear fitting of tumor CI versus (a) fluence, (b) PDT dose, and (c) mean at a 3-mm tumor depth in each group. The gray area in each figure shows the upper and lower bounds of the fit with 95% confidence level. The solid lines show the best-fit to the data using functional forms, for (a), for (b), and for (c) with goodness of fit of , 0.79, and 0.93 for (a), (b), and (c), respectively.

