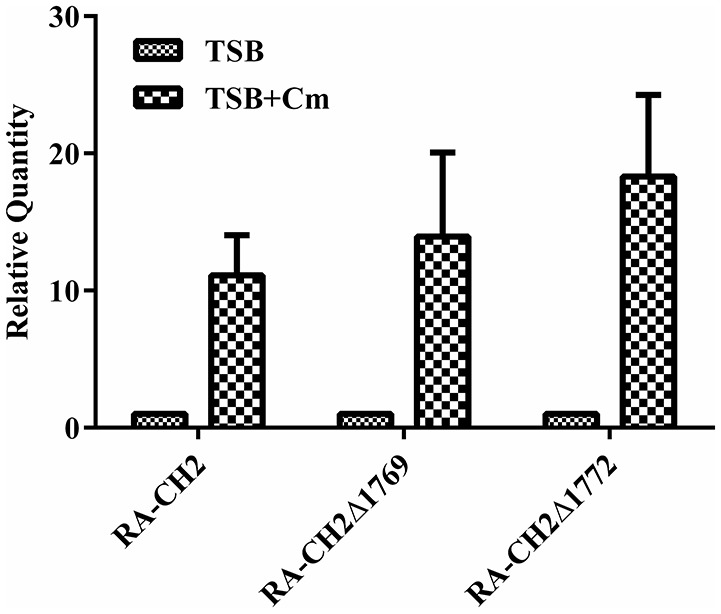
Figure 2.

mRNA level of cat genes in chloramphenicol-induced RA-CH2 and mutant strains RA-CH2Δ1769, RA-CH2Δ1772. The changes of mRNAs were expressed as fold expression and calculated using the comparative CT (2−ΔΔCT) method. The error bars represent the standard deviation of three independent experiments.
