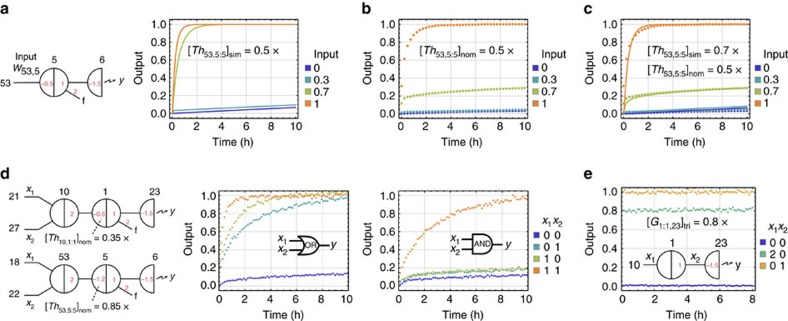
Figure 3. Calibrating effective concentrations.
(a) Simulations and (b) experimental data of digital signal restoration. (c) Estimating effective threshold concentration by fitting simulations to the data obtained. (d) OR and AND logic gates constructed using adjusted nominal threshold concentrations. (e) Estimating effective gate concentration. Data show steady-state fluorescence level. 1 × =100 nM. Here and in later figures, all output signals in the data were normalized using the minimum fluorescence signal (the first data point) of an OFF trajectory as 0 and the maximum fluorescence signal (the average of the last five data points) of an ON trajectory as 1.

