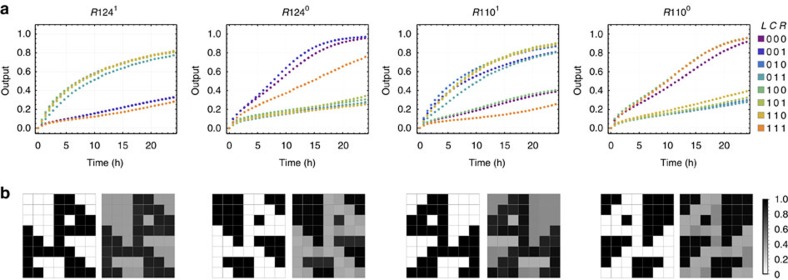
Figure 7. Implementing the rule 110–124 full circuit.
(a) Fluorescence kinetics data of the two pairs of dual-rail outputs. 1 × =100 nM. All DNA sequences are listed in Supplementary Table 1. (b) Comparing the ideal logic circuit behaviour (left) with the DNA circuit behaviour (right). Each of the circuit outputs is illustrated by an array of 7 × 8 cells, representative of eight cellular automata generations on a torus with starting configuration (0,0,0,1,0,0,0). The arrays for the DNA circuit were plotted using the output values at 24 h from the data. The ideal logic circuit behaviour corresponds to an image of a black dog with a white background for R1241, an inverted image for R1240 and their mirror images for R1101 and R1100, respectively.

