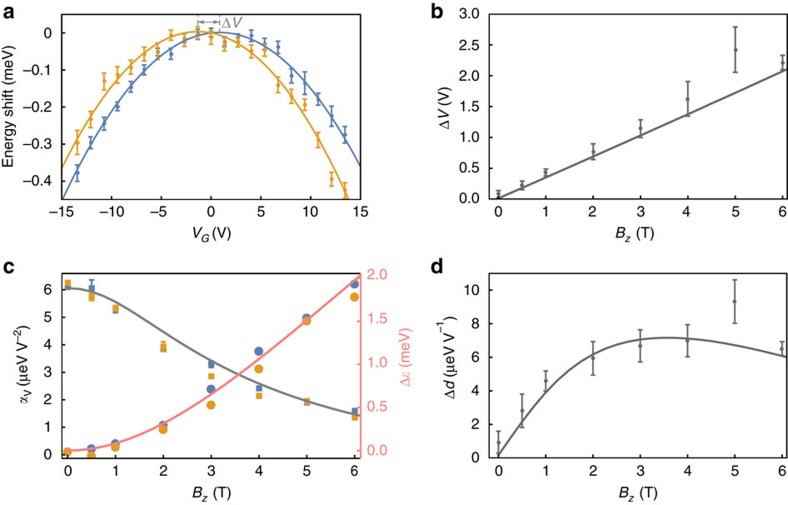
Figure 2. Magnetic field dependence.
(a) Shift of polariton energies with applied voltage for polaritons excited with  (yellow) and
  (blue) at Bz=5 T; solid lines are fits to second-order polynomials (−dVVG−αV
 , blue: dV=3.0 × 10⁻⁶ eV V−1, αV=1.8 × 10⁻⁶ eV V−2, yellow: dV=−5.2 × 10⁻⁶ eV V−1, αV=1.9 × 10⁻⁶ eV V−2). Error bars represent 1 s.d. of the polariton resonance energy extracted from a fit of the data to a reflection lineshape (see Supplementary Note 3). Grey dashed lines indicate the voltage at which maximum energy occurs for the two parabolas, the grey arrow indicates the difference between them (ΔV). (b) Using data such as a at different Bz, difference between the extracted voltage (ΔV) at which maximum energy occurs for
  and
and  excitations. (c) Change in αV (polarizability) with Bz (filled squares, left axis, and grey curve). Change of lower polariton resonant energy with Bz at VG=0 V (filled circles, right axis, and red curve) from the value at Bz=0 T. Yellow and blue data points are data for
  and
and  , respectively. (d) Difference between extracted dV values (electric dipole moment) for polaritons propagating with
  and
and  . For b–d, error bars are the estimated standard deviations of the mean for three repetitions of the experiment (some error bars are smaller than the markers), and the solid lines are results of a numerical calculation (see Supplementary Note 4).

