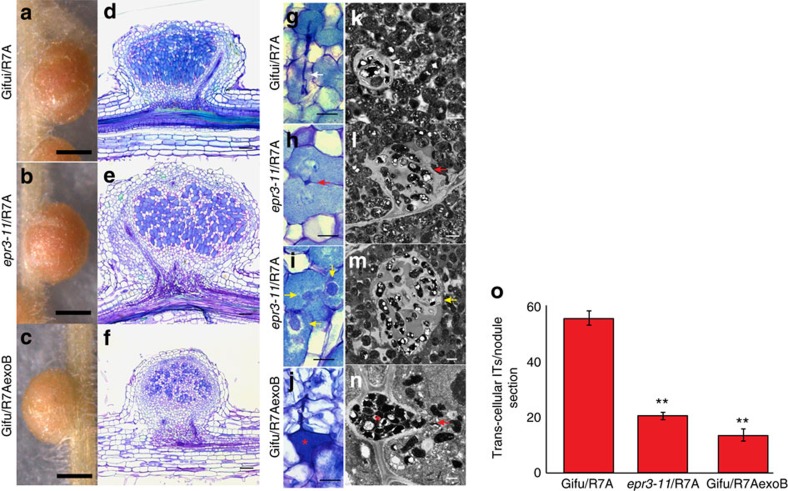
Figure 2. Nodule infection phenotype in Gifu and epr3 mutants.
Images of intact nodules, semi-thin microscopy sections and TEM sections from Gifu inoculated with R7A (a,d,g,k), epr3-11 inoculated with R7A (b,e,h,i,l,m) and Gifu inoculated with R7AexoB (c,f,j,n). Plants were grown at 21 °C and nodules sectioned 14 dpi. Light microscopy and transmission electron micrographs of sectioned nodules illustrate the infection mechanisms (g–n). White arrows indicate transcellular infection threads. Red arrows indicate peg-type intercellular infection. Yellow arrows indicate infection thread protrusions. Red stars indicate the intercellular bacteria. Scale bars, 0.5 mm (a–c); 0.1 mm (d–f), 20 μm (g–j); 1 μm (k–n). (o) Number of cortical infection threads observed in nodules at 14 days post infection (dpi). Gifu and epr3-11 inoculated with R7A and Gifu inoculated with R7AexoB. Number of cortical infection threads was counted in randomly selected sections of five nodules from each combination. ** (P<0.01, Student's t-test, n=25) indicates significant difference compared to Gifu inoculated with R7A. Error bars are s.e.m.

