-
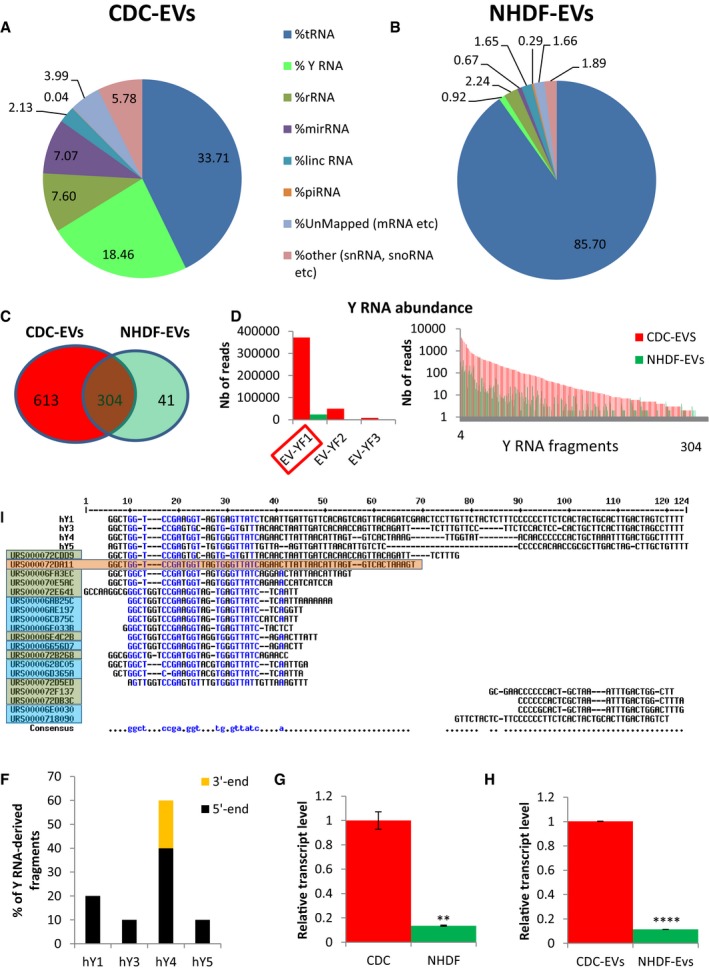
A, B
Pie chart depicting the percent distribution of small RNA species in CDC‐EVs (A) and NHDF‐EVs (B), collected following 5 days of serum‐free culture.
-
C
Venn diagram depicting the number of unique and common Y RNA sequences in CDC‐EVs and NHDF‐EVs.
-
D
Graphical depictions of the abundance of the common Y RNA fragments in CDC‐EVs and NHDF‐EVs according to the number of reads obtained by RNA‐seq. Left graph: top three most abundant Y RNA fragments (linear scale). Right graph: the remaining 301 Y RNA fragments (logarithmic scale).
-
E
Sequence alignment of each full‐length human Y RNA (hY1, hY3, hY4, and hY5) with Y RNA fragments. Highlighted here are the top nine Y RNA fragments uniquely expressed in CDC‐EVs (blue; 9/613 in C) and the top 10 commonly expressed between CDC‐EVs and NHDF‐EVs (green; 10/304 in C). The most highly expressed Y RNA fragment (EV‐YF1) is highlighted in orange.
-
F
Proportion of Y RNA fragments derived from the 5′‐ or 3′‐end of the four full‐length human Y RNA genes.
-
G, H
Relative expression of EV‐YF1 by qPCR in CDCs and NHDFs (G) and their respective EVs (H). Results depict the mean ± SEM of two independent experiments, n = 6. Groups were compared using two‐tailed, unpaired, Student's t‐test; (G) **P = 0.0024; (H) ****P < 0.0001.