
Figure 2. CDC‐EVs EV‐YF1 content correlates with CDC potency in vivo .
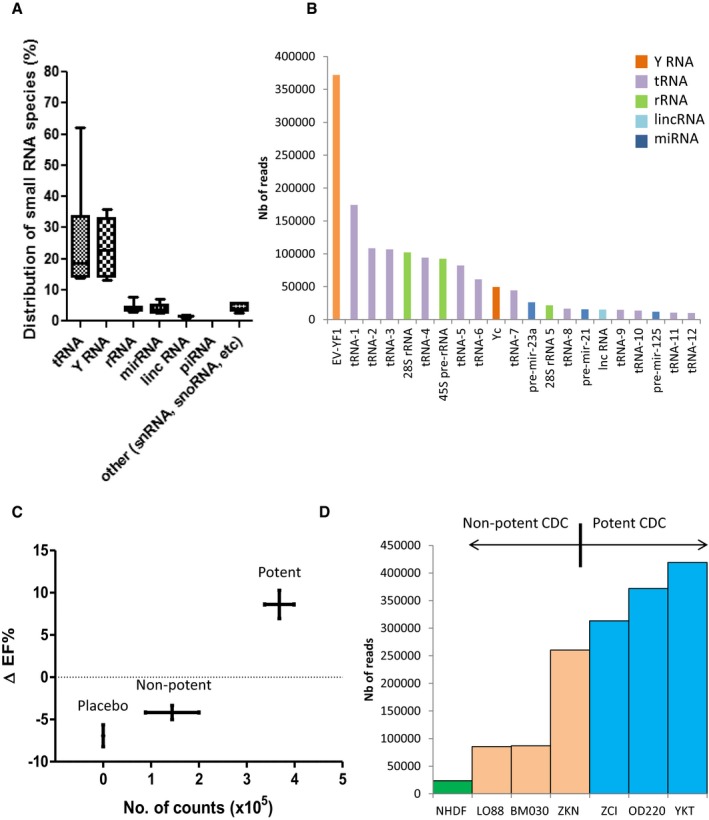
- Graph depicting the percent distribution of small RNA species in CDC‐EVs from six different donors (as shown in Table 1). Horizontal lines represent the median value, box limits represent 75 and 25% percentile of the total values and the bars represent the maximal and minimal value.
- Graph representing the most abundant sequences expressed in OD220 CDC‐EVs. EV‐YF1: URS000072DA11; tRNA‐1: URS00006FBEE8; tRNA‐2: URS000072EF3B; tRNA‐3: URS0000758E15; 28S rRNA: URS00003692B6; tRNA‐4: URS000072CC66; 45S pre‐rRNA: URS000025EB0F; tRNA‐5: URS000072F18F; tRNA‐6: URS000072F2C3; Yc: URS000072E641; tRNA‐7: URS000072B56D; pre‐mir‐23a: URS000075EDA8; 28S rRNA 5: URS000075EC78; tRNA‐8: URS0000701715; pre‐mir‐21: URS000075E5CC; long non‐coding RNA (Mir17hg gene): URS000076343C; tRNA‐9: URS00006A0CFD; tRNA‐10: URS0000717173; pre‐mir‐12: URS00007A4AA9; tRNA‐11: URS0000750232; tRNA‐12: URS000072345A.
- Correlation between the percent change in ejection fraction (baseline 2 h post‐MI to 21 days, ΔEF%) post‐MI with CDC treatment (six different donors, n = 8 animals/donor) or placebo (n = 14 animals) and EV‐YF1 abundance in CDC‐EVs. Potent CDCs (ZCI, YKT, OD220) were delineated from non‐potent CDCs (LO88, BM030, ZKN) by positive ΔEF%. Error bars represent the SEM of the delta ejection fraction % between animals treated with placebo, non‐potent or potent CDCs, respectively.
- EV‐YF1 abundance based on RNA‐seq counts in EVs from potent (ZCI, YKT, OD220) and non‐potent CDCs (LO88, BM030, ZKN) and NHDFs.