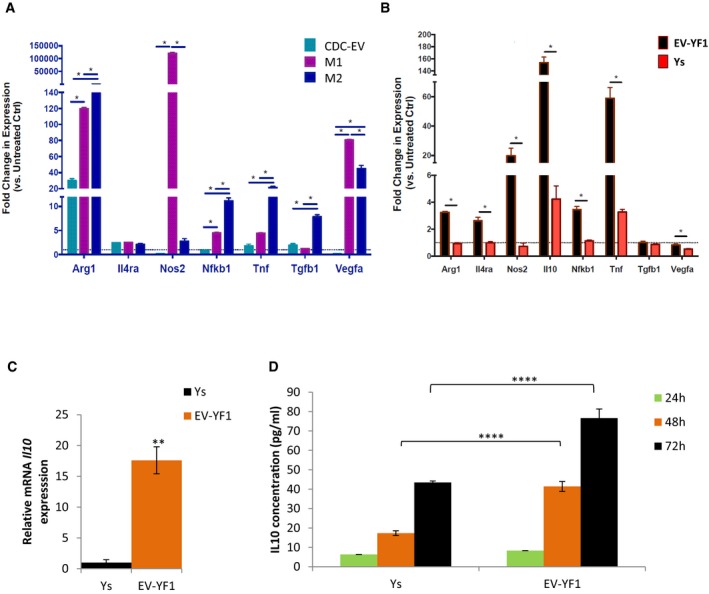
Gene expression profile by qPCR of BMDMs polarized toward M1 (IFNγ and LPS), M2 (IL‐4 and IL‐13) or treated with CDC‐EVs (versus untreated control BMDM, dotted line). Results depict the mean ± SEM of two independent experiments, n = 3 each. Statistical significance was determined using multiple t‐tests followed by Holm–Sidak's multiple corrections test; *P < 0.05.
Gene expression profile by qPCR of BMDMs primed with EV‐YF1 or Ys (versus untreated control BMDM, dotted line). Results depict the mean ± SEM of two independent experiments, n = 3 each. Statistical significance was determined using multiple t‐tests followed by Holm–Sidak's multiple corrections test; *P < 0.05.
Gene expression of Il10 in BMDMs following transfection with EV‐YF1 or Ys, as determined by qPCR. Results depict the mean ± SEM of two independent experiments, n = 6 each. Groups were compared using two‐tailed, unpaired, Student's t‐test; **P < 0.0044.
Protein secretion of IL‐10 from BMDMs at 24, 48, and 72 h following transfection with EV‐YF1 or Ys, by ELISA. Results depict the mean ± SEM of an experiment representative of two independent experiments, n = 6 each. Groups were compared using one‐way ANOVA followed by Tukey's multiple comparisons test; ****P < 0.0001.