-
A
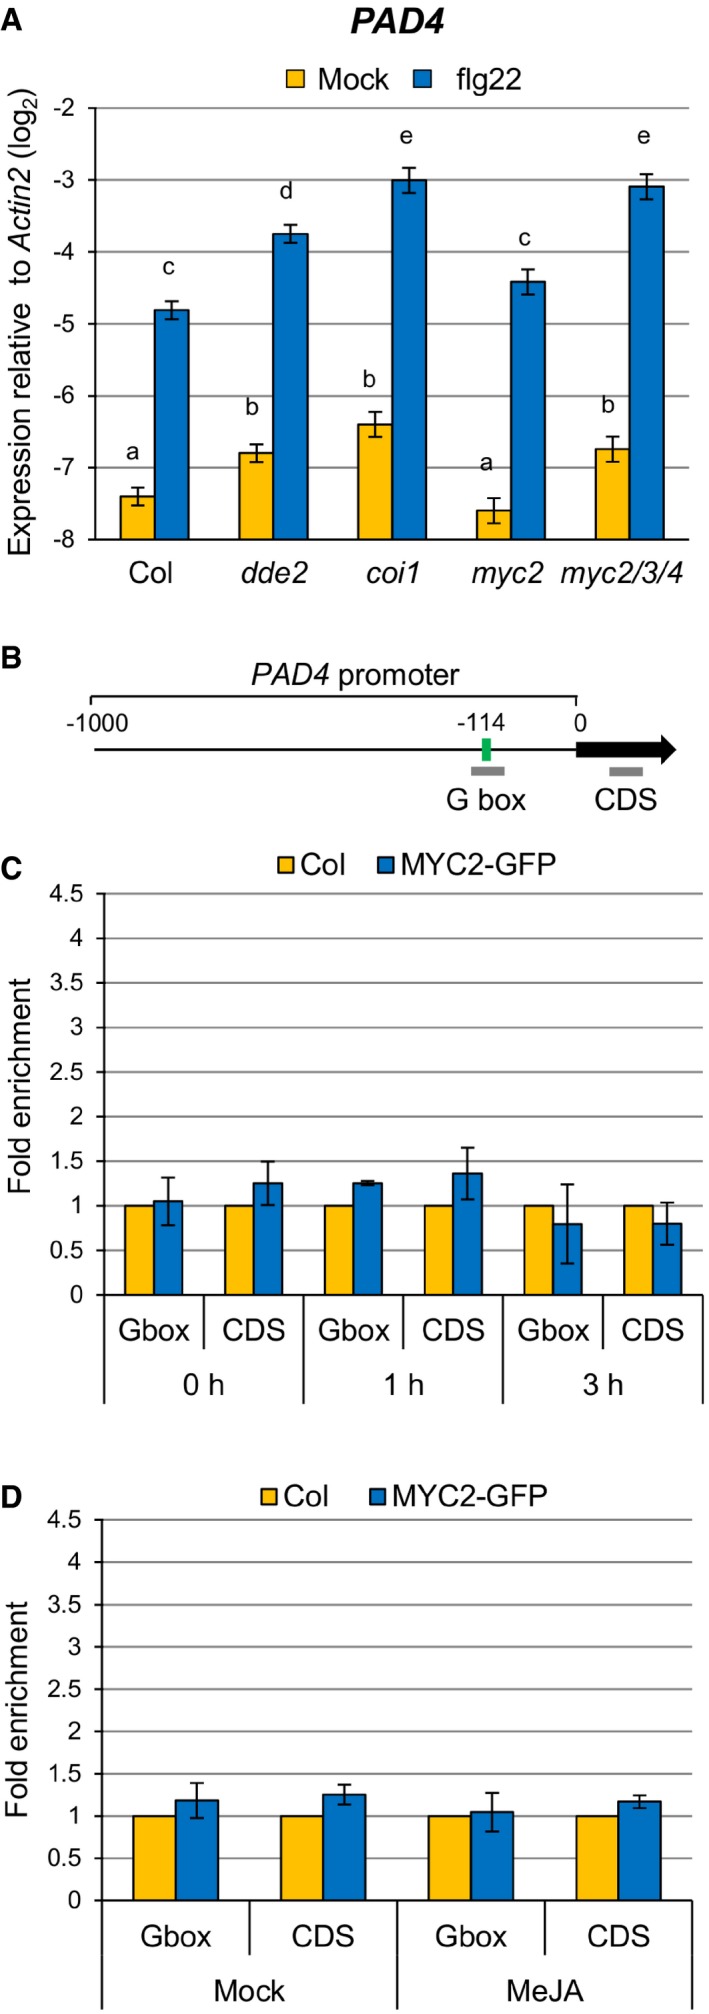
RT–qPCR analysis of PAD4 expression in leaves infiltrated with water (mock) or 1 μM flg22 at 9 hpi. Bars represent means and standard errors of the log2 expression level relative to Actin2 calculated from four independent experiments using a mixed linear model.
-
B
PAD4 promoter showing the G box motif located 114 bp upstream of the transcription start site. Bold gray horizontal lines show the regions amplified by different qPCR primers.
-
C, D
ChIP‐qPCR analysis of MYC2 binding to the PAD4 promoter. MYC2‐GFP seedlings were treated with 1 μM flg22 for the indicated time periods (C) or 100 μM MeJA for 3 h (D). Bars represent means and standard errors of the fold enrichment relative to the wild‐type plants set to 1, calculated from two independent experiments.
Data information: In (A), the Benjamini–Hochberg method was used to adjust
P‐values (two‐tailed
t‐tests) for correcting multiple hypothesis testing and statistically significant differences are indicated by different letters (adjusted
P‐value < 0.05).

