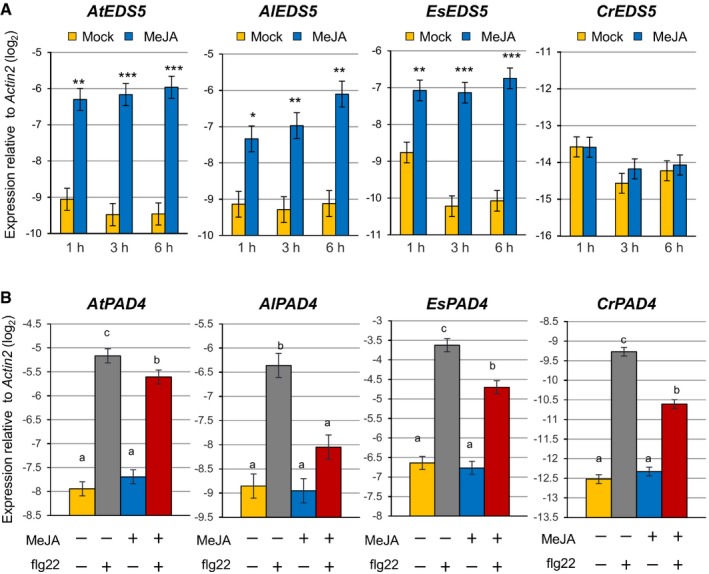
A, BRT–qPCR analysis of EDS5 (A) and PAD4 (B) expression in seedlings of Arabidopsis thaliana, Arabidopsis lyrata, Capsella rubella, and Eutrema salsugineum. In (A), seedlings were treated with mock (water) or MeJA (100 μM) for the indicated time periods. Asterisks indicate statistically significant differences from the mock controls at each time point (*P < 0.05, **P < 0.01, ***P < 0.001; two‐tailed t‐tests). In (B), seedlings were treated with mock (water) or MeJA (100 μM) for 3 h, followed by treatment with mock (water) or flg22 (1 μM) for 30 min. The Benjamini–Hochberg method was used to adjust P‐values (two‐tailed t‐tests) for correcting multiple hypothesis testing, and statistically significant differences were indicated by different letters (adjusted P‐value < 0.05). Bars represent means and standard errors of the log2 expression levels relative to Actin2 calculated from two independent experiments using mixed linear models.

